Results
| Country: | U.S.A.
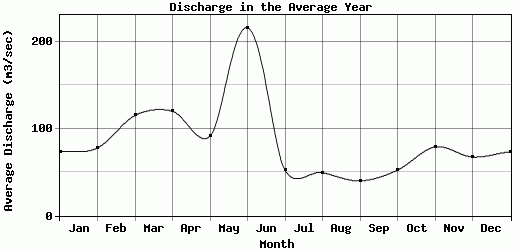
| | Station: | CHARLESTON, WV | | River: | KANAWHA RIVER | | Area: | 26983.61 | | Lat: | 38.37 | | Lon: | -81.7 | | Source: | USGS | | PointID: | 3198000 | | Area Units: | km2 | | Discharge Units: | m3/sec | | Starting Year: | 1989 | | Ending Year: | 1990 | | Total Years: | 2 | | Total Usable Years: | 1 | |
| |
| Year | Jan | Feb | Mar | Apr | May | Jun | Jul | Aug | Sep | Oct | Nov | Dec | Avg Annual |
|---|
| 1989 | 73.54 | 77.85 | 115.27 | 120.01 | 91.51 | 216.04 | 52.22 | 49.54 | 40.09 | 52.4 | 79.02 | 67.49 | 86.25 |
| 1990 | -9999 | -9999 | -9999 | -9999 | -9999 | -9999 | -9999 | -9999 | -9999 | -9999 | -9999 | -9999 | -9999 |
| |
|
|
|
|
|
|
|
|
|
|
|
|
|
| Avg | 73.54 | 77.85 | 115.27 | 120.01 | 91.51 | 216.04 | 52.22 | 49.54 | 40.09 | 52.4 | 79.02 | 67.49 | 86.25 |
| |
|
|
|
|
|
|
|
|
|
|
|
|
|
| Std Dev | 0 |
0 |
0 |
0 |
0 |
0 |
0 |
0 |
0 |
0 |
0 |
0 |
0 |
| |
|
|
|
|
|
|
|
|
|
|
|
|
|
| | Jan | Feb | Mar | Apr | May | Jun | Jul | Aug | Sep | Oct | Nov | Dec | Avg Annual |
Click here for this table in tab-delimited format.
Tab-delimited format will open in most table browsing software, i.e. Excel, etc.
View this station on the map.
Return to start.