Results
| Country: | Tunisia
| | Station: | Sloughia | | River: | Mejerdah | | Area: | 20895 km2 | | Lat: | 36.58 | | Lon: | 9.51 | | Source: | RivDIS | | PointID: | 734 | | Area Units: | km2 | | Discharge Units: | m3/sec | | Starting Year: | 1976 | | Ending Year: | 1979 | | Total Years: | 4 | | Total Usable Years: | 4 | |
| |
| Year | Jan | Feb | Mar | Apr | May | Jun | Jul | Aug | Sep | Oct | Nov | Dec | Avg Annual |
|---|
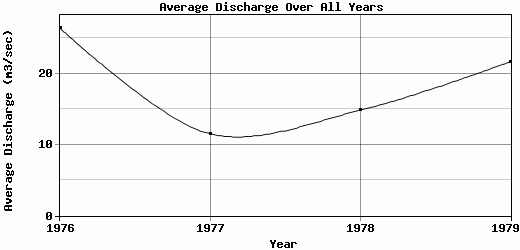
| 1976 | 13 | 19 | 29 | 14 | 39 | 18.5 | 28 | 19 | 22.5 | 21 | 63 | 31.5 | 26.46 |
| 1977 | 23.5 | 12.5 | 7.3 | 16.5 | 10 | 12.5 | 8.7 | 11 | 8.6 | 7.8 | 11.5 | 8.6 | 11.54 |
| 1978 | 9.5 | 61.5 | 13.5 | 30 | 10.5 | 12 | 10 | 13.5 | 1.7 | 3.5 | 6 | 6.3 | 14.83 |
| 1979 | 4.3 | 12.5 | 16.5 | 49 | 11.5 | 12 | 11.5 | 8.9 | 32.5 | 30.5 | 51 | 19.5 | 21.64 |
| |
|
|
|
|
|
|
|
|
|
|
|
|
|
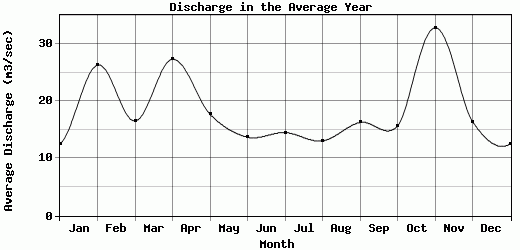
| Avg | 12.58 | 26.38 | 16.58 | 27.38 | 17.75 | 13.75 | 14.55 | 13.1 | 16.33 | 15.7 | 32.88 | 16.48 | 18.62 |
| |
|
|
|
|
|
|
|
|
|
|
|
|
|
| Std Dev | 7.03 |
20.45 |
7.9 |
13.89 |
12.28 |
2.75 |
7.83 |
3.78 |
11.97 |
10.7 |
24.57 |
10.01 |
5.81 |
| |
|
|
|
|
|
|
|
|
|
|
|
|
|
| | Jan | Feb | Mar | Apr | May | Jun | Jul | Aug | Sep | Oct | Nov | Dec | Avg Annual |
Click here for this table in tab-delimited format.
Tab-delimited format will open in most table browsing software, i.e. Excel, etc.
View this station on the map.
Return to start.