Results
| Country: | Togo
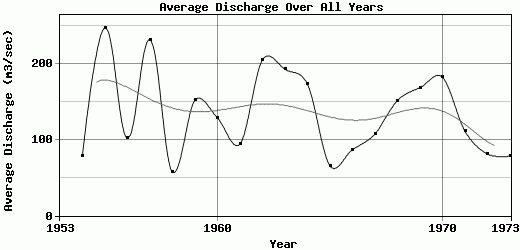
| | Station: | Mango | | River: | Oti | | Area: | 35650 km2 | | Lat: | 10.3 | | Lon: | 0.47 | | Source: | RivDIS | | PointID: | 1529 | | Area Units: | km2 | | Discharge Units: | m3/sec | | Starting Year: | 1953 | | Ending Year: | 1973 | | Total Years: | 21 | | Total Usable Years: | 20 | |
| |
| Year | Jan | Feb | Mar | Apr | May | Jun | Jul | Aug | Sep | Oct | Nov | Dec | Avg Annual |
|---|
| 1953 | -9999 | -9999 | -9999 | -9999 | 24.5 | 155 | 96 | 257 | 953 | 582 | 86.9 | 14 | -9999 |
| 1954 | 7 | 4 | 3 | 1.5 | 7 | 31.3 | 25.3 | 107 | 418 | 271 | 56.8 | 13.1 | 78.75 |
| 1955 | 6.7 | 3 | 1.5 | 0.47 | 1.76 | 10.3 | 122 | 814 | 1140 | 732 | 115 | 15.8 | 246.88 |
| 1956 | 7.16 | 4.41 | 1.94 | 1.84 | 1.13 | 19.7 | 58.3 | 197 | 550 | 342 | 29.6 | 8.31 | 101.78 |
| 1957 | 3.94 | 1.51 | 0.97 | 0.66 | 11.3 | 78 | 80.1 | 380 | 1220 | 861 | 115 | 21.7 | 231.18 |
| 1958 | 9.69 | 6.81 | 4.18 | 2.05 | 3.66 | 11.8 | 8.07 | 121 | 356 | 149 | 11.3 | 1.57 | 57.09 |
| 1959 | 2.83 | 1.91 | 1.14 | 0.48 | 0.47 | 8.91 | 64 | 245 | 893 | 564 | 32.6 | 6.69 | 151.75 |
| 1960 | 2.92 | 1.5 | 0.75 | 0.64 | 1.65 | 10.9 | 43.4 | 133 | 534 | 744 | 60.7 | 8.75 | 128.52 |
| 1961 | 3.43 | 1.75 | 0.99 | 0.6 | 0.69 | 3.66 | 106 | 165 | 565 | 262 | 16.1 | 5.04 | 94.19 |
| 1962 | 2.26 | 1.19 | 0.66 | 0.39 | 1.22 | 12.3 | 107 | 397 | 1240 | 600 | 78.7 | 15.8 | 204.71 |
| 1963 | 6.3 | 3.34 | 2.19 | 1.16 | 10.1 | 7.87 | 186 | 566 | 864 | 533 | 110 | 19.3 | 192.44 |
| 1964 | 7.82 | 3.56 | 1.94 | 1.18 | 0.68 | 9.6 | 56.7 | 341 | 874 | 684 | 79.3 | 13.4 | 172.77 |
| 1965 | 5.11 | 3.22 | 1.59 | 0.74 | 0.75 | 7.16 | 36.4 | 163 | 346 | 187 | 25.7 | 9.28 | 65.5 |
| 1966 | 3.34 | 1.26 | 0.49 | 0.32 | 2.15 | 20.8 | 20.3 | 174 | 377 | 351 | 74.8 | 15 | 86.71 |
| 1967 | 6.09 | 2.35 | 0.98 | 0.53 | 0.98 | 16.3 | 29.5 | 247 | 507 | 403 | 60.2 | 13.4 | 107.28 |
| 1968 | 6.54 | 2.88 | 1.1 | 0.6 | 6.84 | 66.3 | 293 | 475 | 526 | 350 | 71.2 | 16.2 | 151.31 |
| 1969 | 6.46 | 3.55 | 1.83 | 2.49 | 4.06 | 5.67 | 88.9 | 189 | 1010 | 561 | 120 | 25.6 | 168.21 |
| 1970 | 9.98 | 5.71 | 2.63 | 1.27 | 5.36 | 3.79 | 28.9 | 256 | 1020 | 781 | 57 | 11.6 | 181.94 |
| 1971 | 7.97 | 4.66 | 1.99 | 1.62 | 3.81 | 9.98 | 67.7 | 356 | 661 | 183 | 22.1 | 13.5 | 111.11 |
| 1972 | 5 | 2 | 0.55 | 0.64 | 2.87 | 4.76 | 30.5 | 148 | 436 | 300 | 34.5 | 7.83 | 81.05 |
| 1973 | 4.47 | 2.57 | 1.36 | 1.73 | 1.95 | 9.07 | 27.9 | 409 | 356 | 107 | 13.9 | 4.81 | 78.31 |
| |
|
|
|
|
|
|
|
|
|
|
|
|
|
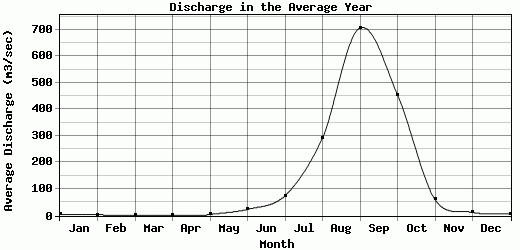
| Avg | 5.75 | 3.06 | 1.59 | 1.05 | 4.43 | 23.96 | 75.05 | 292.38 | 706.95 | 454.62 | 60.54 | 12.41 | 134.57 |
| |
|
|
|
|
|
|
|
|
|
|
|
|
|
| Std Dev | 2.17 |
1.47 |
0.9 |
0.62 |
5.41 |
34.9 |
64.11 |
169.39 |
297.96 |
222.88 |
34.72 |
5.7 |
55.62 |
| |
|
|
|
|
|
|
|
|
|
|
|
|
|
| | Jan | Feb | Mar | Apr | May | Jun | Jul | Aug | Sep | Oct | Nov | Dec | Avg Annual |
Click here for this table in tab-delimited format.
Tab-delimited format will open in most table browsing software, i.e. Excel, etc.
View this station on the map.
Return to start.