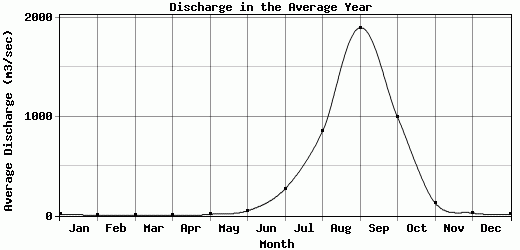
Results
| Country: | Ghana
| | Station: | Sabari | | River: | Oti | | Area: | 59550 km2 | | Lat: | 9.28 | | Lon: | 0.23 | | Source: | RivDIS | | PointID: | 1496 | | Area Units: | km2 | | Discharge Units: | m3/sec | | Starting Year: | 1959 | | Ending Year: | 1974 | | Total Years: | 16 | | Total Usable Years: | 14 | |
| |
| Year | Jan | Feb | Mar | Apr | May | Jun | Jul | Aug | Sep | Oct | Nov | Dec | Avg Annual |
|---|
| 1959 | -9999 | -9999 | -9999 | -9999 | -9999 | 11.3 | 260 | 475 | 1990 | 959 | 73.2 | 15.3 | -9999 |
| 1960 | 6.95 | 3.69 | 2.35 | 4.36 | 8.48 | 37.9 | 235 | 475 | 1850 | 1900 | 113 | 22.9 | 388.3 |
| 1961 | 9.01 | 4.45 | 2.57 | 3.75 | 9.09 | 48.5 | 361 | 481 | 1070 | 504 | 30.2 | 8.51 | 211.01 |
| 1962 | 4.24 | 2.99 | 1.28 | 2.61 | 10.8 | 160 | 362 | 1180 | 3040 | 1670 | 160 | 40.6 | 552.88 |
| 1963 | 13.4 | 7.25 | 6.08 | 5.12 | 21.7 | 12.7 | 593 | 1580 | 2810 | 1460 | 339 | 47.1 | 574.61 |
| 1964 | 15.8 | 7.69 | 3.62 | 7.63 | 6.3 | 17.5 | 88.6 | 619 | 1830 | 1150 | 109 | 38.5 | 324.47 |
| 1965 | 23.6 | 14.4 | 9.68 | 9.88 | 20 | 46.9 | 157 | 534 | 1080 | 344 | 42.7 | 9.11 | 190.94 |
| 1966 | 3.64 | 2.21 | 1.12 | 0.88 | 4.74 | 60.1 | 108 | 621 | 1140 | 778 | 155 | 24.4 | 241.59 |
| 1967 | 6.51 | 3.18 | 1.99 | 4.34 | 5.48 | 34.7 | 203 | 1100 | 1600 | 947 | 199 | 27.5 | 344.39 |
| 1968 | 11.9 | 6.9 | 9.24 | 17 | 35.2 | 216 | 883 | 1480 | 1780 | 772 | 127 | 32 | 447.52 |
| 1969 | 16.8 | 10.9 | 5.95 | 16.7 | 21.8 | 24.9 | 283 | 693 | 2580 | 1410 | 286 | 60.8 | 450.82 |
| 1970 | 20.1 | 11.1 | 5.75 | 2.81 | 9.21 | 9.62 | 48.9 | 877 | 3010 | 1600 | 103 | 28.1 | 477.13 |
| 1971 | 9.17 | 5.13 | 3.75 | 8.09 | 7.92 | 18.9 | 305 | 1350 | 2220 | 691 | 122 | 23.7 | 397.06 |
| 1972 | 8.28 | 4.34 | 2.2 | 2.99 | 15.6 | 38.4 | 139 | 409 | 1270 | 308 | 48.1 | 15.8 | 188.48 |
| 1973 | 9.41 | 4.08 | 2.1 | 1.57 | 3.4 | 7.56 | 30.2 | 860 | 1140 | 389 | 38.1 | 9.74 | 207.93 |
| 1974 | 4.89 | 2.77 | -9999 | -9999 | -9999 | -9999 | -9999 | -9999 | -9999 | -9999 | -9999 | -9999 | -9999 |
| |
|
|
|
|
|
|
|
|
|
|
|
|
|
| Avg | 10.91 | 6.07 | 4.12 | 6.27 | 12.84 | 49.67 | 270.45 | 848.93 | 1894 | 992.13 | 129.69 | 26.94 | 356.94 |
| |
|
|
|
|
|
|
|
|
|
|
|
|
|
| Std Dev | 5.75 |
3.49 |
2.7 |
4.96 |
8.64 |
57.3 |
215.95 |
382.47 |
681.05 |
500 |
86.33 |
14.48 |
129.22 |
| |
|
|
|
|
|
|
|
|
|
|
|
|
|
| | Jan | Feb | Mar | Apr | May | Jun | Jul | Aug | Sep | Oct | Nov | Dec | Avg Annual |
Click here for this table in tab-delimited format.
Tab-delimited format will open in most table browsing software, i.e. Excel, etc.
View this station on the map.
Return to start.

