Results
| Country: | Central_African_Rep.
| | Station: | Batangafo | | River: | Ouham | | Area: | 44700 km2 | | Lat: | 7.3 | | Lon: | 18.28 | | Source: | RivDIS | | PointID: | 1476 | | Area Units: | km2 | | Discharge Units: | m3/sec | | Starting Year: | 1951 | | Ending Year: | 1966 | | Total Years: | 16 | | Total Usable Years: | 13 | |
| |
| Year | Jan | Feb | Mar | Apr | May | Jun | Jul | Aug | Sep | Oct | Nov | Dec | Avg Annual |
|---|
| 1951 | -9999 | -9999 | -9999 | -9999 | 80 | 90.3 | 131 | 664 | 809 | 926 | 467 | 194 | -9999 |
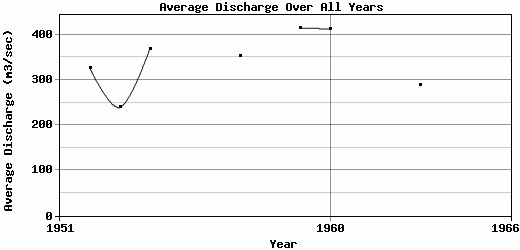
| 1952 | 120 | 89.9 | 64.9 | 63.9 | 82.5 | 94.5 | 207 | 662 | 1010 | 818 | 480 | 216 | 325.72 |
| 1953 | 132 | 97.1 | 94.1 | 75.6 | 77.3 | 82.3 | 278 | 356 | 644 | 635 | 273 | 126 | 239.2 |
| 1954 | 61.6 | 47.2 | 46.2 | 43 | 54.2 | 163 | 333 | 487 | 1010 | 1210 | 687 | 286 | 369.02 |
| 1955 | 158 | 84.6 | 75 | 104 | 126 | 218 | 566 | 875 | -9999 | -9999 | -9999 | -9999 | -9999 |
| 1956 | -9999 | -9999 | -9999 | -9999 | 100 | 168 | 396 | 759 | 1100 | 1220 | 524 | 283 | -9999 |
| 1957 | 186 | 143 | 112 | 142 | 172 | 211 | 292 | 638 | 906 | 663 | 514 | 256 | 352.92 |
| 1958 | 150 | 109 | 88.1 | 94.6 | 79 | 106 | 263 | -9999 | -9999 | -9999 | -9999 | 200 | -9999 |
| 1959 | 125 | 73.3 | 44.2 | 54 | 106 | 87.4 | 306 | 745 | 1400 | 1160 | 578 | 302 | 415.08 |
| 1960 | 198 | 128 | 84.9 | 82.2 | 99.7 | 98.8 | 310 | 624 | 982 | 1270 | 742 | 330 | 412.47 |
| 1961 | 220 | 142 | 89.4 | 46 | 40.5 | 109 | 395 | 986 | -9999 | 1370 | 763 | -9999 | -9999 |
| 1962 | -9999 | -9999 | 77.1 | 54.3 | 58 | 80.2 | 189 | 631 | 780 | 659 | 365 | 125 | -9999 |
| 1963 | 80 | 50 | 38.3 | 36.8 | 73.7 | 128 | 264 | 605 | 940 | 638 | 432 | 181 | 288.9 |
| 1964 | 116 | 78.8 | 49.8 | 34.6 | -9999 | -9999 | -9999 | -9999 | -9999 | -9999 | -9999 | -9999 | -9999 |
| 1965 | -9999 | -9999 | -9999 | 15 | 23.1 | 122 | 163 | 293 | 595 | 229 | 57.1 | 25.9 | -9999 |
| 1966 | 15.9 | 9.76 | 5.17 | -9999 | -9999 | -9999 | -9999 | -9999 | -9999 | -9999 | -9999 | -9999 | -9999 |
| |
|
|
|
|
|
|
|
|
|
|
|
|
|
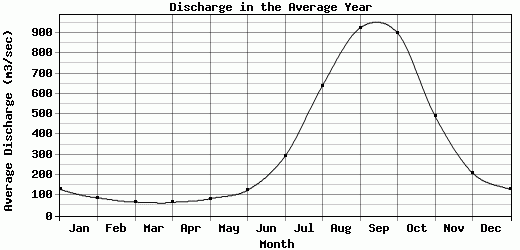
| Avg | 130.21 | 87.72 | 66.86 | 65.08 | 83.71 | 125.61 | 292.36 | 640.38 | 925.09 | 899.83 | 490.18 | 210.41 | 343.33 |
| |
|
|
|
|
|
|
|
|
|
|
|
|
|
| Std Dev | 55.95 |
38.31 |
27.86 |
32.86 |
35.71 |
44.75 |
107.21 |
181.28 |
212.53 |
333.5 |
191.58 |
84.4 |
59.52 |
| |
|
|
|
|
|
|
|
|
|
|
|
|
|
| | Jan | Feb | Mar | Apr | May | Jun | Jul | Aug | Sep | Oct | Nov | Dec | Avg Annual |
Click here for this table in tab-delimited format.
Tab-delimited format will open in most table browsing software, i.e. Excel, etc.
View this station on the map.
Return to start.