Results
| Country: | Brazil
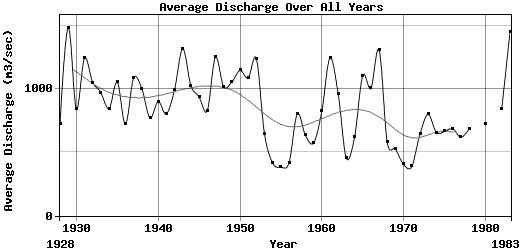
| | Station: | Campos | | River: | Paraibado Sul | | Area: | 55083 km2 | | Lat: | -21.75 | | Lon: | -41.33 | | Source: | | | PointID: | 518 | | Area Units: | km2 | | Discharge Units: | m3/sec | | Starting Year: | 1928 | | Ending Year: | 1983 | | Total Years: | 56 | | Total Usable Years: | 54 | |
| |
| Year | Jan | Feb | Mar | Apr | May | Jun | Jul | Aug | Sep | Oct | Nov | Dec | Avg Annual |
|---|
| 1928 | 769 | 1335 | 1299 | 948 | 596 | 451 | 385 | 358 | 259 | 349 | 442 | 1449 | 720 |
| 1929 | 2135 | 3256 | 3038 | 1945 | 1315 | 1069 | 794 | 710 | 621 | 558 | 1137 | 1222 | 1483.33 |
| 1930 | 1273 | 1244 | 1106 | 957 | 699 | 560 | 473 | 433 | 409 | 486 | 827 | 1682 | 845.75 |
| 1931 | 1542 | 2936 | 2331 | 1628 | 1015 | 794 | 665 | 567 | 557 | 732 | 835 | 1328 | 1244.17 |
| 1932 | 1966 | 1760 | 1558 | 940 | 840 | 829 | 588 | 508 | 466 | 582 | 803 | 1779 | 1051.58 |
| 1933 | 2577 | 1346 | 1133 | 846 | 689 | 561 | 548 | 448 | 479 | 662 | 787 | 1586 | 971.83 |
| 1934 | 2488 | 1028 | 1147 | 831 | 691 | 537 | 460 | 373 | 401 | 434 | 444 | 1317 | 845.92 |
| 1935 | 1526 | 3276 | 1687 | 1152 | 840 | 676 | 565 | 501 | 463 | 647 | 584 | 720 | 1053.08 |
| 1936 | 544 | 716 | 1817 | 1204 | 659 | 492 | 430 | 371 | 460 | 443 | 518 | 1013 | 722.25 |
| 1937 | 2091 | 2394 | 1073 | 938 | 866 | 629 | 505 | 404 | 337 | 591 | 924 | 2299 | 1087.58 |
| 1938 | 1915 | 1540 | 1396 | 1059 | 814 | 696 | 563 | 610 | 520 | 670 | 889 | 1368 | 1003.33 |
| 1939 | 1660 | 1540 | 895 | 1028 | 661 | 525 | 464 | 391 | 363 | 376 | 501 | 863 | 772.25 |
| 1940 | 1420 | 1968 | 1740 | 904 | 652 | 540 | 447 | 51 | 339 | 460 | 1151 | 1137 | 900.75 |
| 1941 | 1269 | 853 | 1146 | 957 | 592 | 526 | 534 | 382 | 556 | 667 | 726 | 1446 | 804.5 |
| 1942 | 1967 | 1253 | 1541 | 976 | 830 | 615 | 580 | 468 | 399 | 563 | 802 | 1927 | 993.42 |
| 1943 | 3667 | 2429 | 1886 | 1208 | 848 | 753 | 647 | 609 | 555 | 824 | 790 | 1605 | 1318.42 |
| 1944 | 1308 | 2360 | 2302 | 1228 | 884 | 690 | 620 | 507 | 426 | 393 | 568 | 1029 | 1026.25 |
| 1945 | 1513 | 1927 | 1323 | 1192 | 762 | 696 | 679 | 478 | 442 | 407 | 686 | 1147 | 937.67 |
| 1946 | 2280 | 1055 | 1162 | 1047 | 667 | 575 | 489 | 400 | 325 | 494 | 681 | 780 | 829.58 |
| 1947 | 1701 | 1746 | 2988 | 1439 | 959 | 767 | 782 | 674 | 712 | 743 | 912 | 1590 | 1251.08 |
| 1948 | 1534 | 1647 | 1959 | 1179 | 846 | 712 | 570 | 529 | 462 | 463 | 627 | 1691 | 1018.25 |
| 1949 | 1840 | 2638 | 1537 | 1122 | 760 | 717 | 614 | 503 | 436 | 528 | 689 | 1272 | 1054.67 |
| 1950 | 1873 | 2313 | 1672 | 1384 | 1010 | 727 | 619 | 511 | 436 | 568 | 1075 | 1578 | 1147.17 |
| 1951 | 1800 | 1926 | 2222 | 1712 | 996 | 790 | 672 | 598 | 512 | 496 | 452 | 875 | 1087.58 |
| 1952 | 1967 | 2555 | 2561 | 1406 | 882 | 845 | 669 | 580 | 594 | 592 | 965 | 1259 | 1239.58 |
| 1953 | 771 | 958 | 821 | 907 | 650 | 518 | 418 | 339 | 346 | 308 | 663 | 1016 | 642.92 |
| 1954 | 677 | 883 | 513 | 614 | 486 | 338 | 237 | 195 | 169 | 187 | 306 | 378 | 415.25 |
| 1955 | 978 | 482 | 429 | 413 | 263 | 243 | 180 | 151 | 133 | 172 | 389 | 766 | 383.25 |
| 1956 | 815 | 385 | 701 | 398 | 310 | 314 | 221 | 263 | 179 | 197 | 281 | 957 | 418.42 |
| 1957 | 914 | 944 | 1462 | 1543 | 681 | 476 | 379 | 303 | 384 | 306 | 581 | 1673 | 803.83 |
| 1958 | 684 | 1066 | 798 | 781 | 721 | 553 | 426 | 292 | 368 | 417 | 712 | 788 | 633.83 |
| 1959 | 1491 | 668 | 1033 | 835 | 425 | 293 | 246 | 235 | 192 | 236 | 596 | 633 | 573.58 |
| 1960 | 809 | 1284 | 2530 | 988 | 652 | 519 | 442 | 378 | 330 | 318 | 471 | 1177 | 824.83 |
| 1961 | 2997 | 3149 | 2668 | 1447 | 1045 | 749 | 545 | 493 | 393 | 347 | 437 | 661 | 1244.25 |
| 1962 | 1273 | 2836 | 1431 | 818 | 636 | 509 | 413 | 343 | 418 | 528 | 864 | 1471 | 961.67 |
| 1963 | 1212 | 1107 | 790 | 487 | 314 | 258 | 225 | 201 | 160 | 155 | 353 | 199 | 455.08 |
| 1964 | 824 | 1607 | 817 | 544 | 424 | 292 | 352 | 251 | 209 | 395 | 567 | 1147 | 619.08 |
| 1965 | 1996 | 2716 | 1948 | 994 | 1054 | 651 | 582 | 474 | 360 | 622 | 893 | 970 | 1105 |
| 1966 | 2867 | 1118 | 1375 | 998 | 740 | 514 | 477 | 426 | 384 | 526 | 1336 | 1314 | 1006.25 |
| 1967 | 2750 | 3135 | 2700 | 1554 | 930 | 680 | 590 | 457 | 381 | 363 | 888 | 1267 | 1307.92 |
| 1968 | 1348 | 762 | 1039 | 624 | 434 | 336 | 313 | 312 | 340 | 353 | 286 | 802 | 579.08 |
| 1969 | 964 | 712 | 750 | 572 | 319 | 329 | 292 | 245 | 208 | 301 | 633 | 966 | 524.25 |
| 1970 | 681 | 563 | 576 | 373 | 288 | 235 | 251 | 223 | 304 | 360 | 548 | 446 | 404 |
| 1971 | 351 | 205 | 368 | 254 | 207 | 238 | 185 | 153 | 224 | 323 | 747 | 1398 | 387.75 |
| 1972 | 765 | 1095 | 1443 | 694 | 420 | 345 | 361 | 339 | 295 | 461 | 641 | 869 | 644 |
| 1973 | 1300 | 1600 | 1100 | 900 | 680 | 550 | 490 | 430 | 370 | 500 | 800 | 880 | 800 |
| 1974 | 1230 | 880 | 1260 | 1160 | 510 | 450 | 350 | 300 | 265 | 330 | 370 | 770 | 656.25 |
| 1975 | 1750 | 1370 | 760 | 530 | 400 | 320 | 330 | 240 | 220 | 460 | 780 | 830 | 665.83 |
| 1976 | 698 | 832 | 750 | 645 | 468 | 459 | 474 | 482 | 511 | 717 | 874 | 1324 | 686.17 |
| 1977 | 1215 | 921 | 576 | 692 | 456 | 342 | 306 | 255 | 345 | 356 | 702 | 1263 | 619.08 |
| 1978 | 1594 | 1077 | 1038 | 695 | 513 | 478 | 419 | 342 | 318 | 361 | 538 | 832 | 683.75 |
| 1979 | -9999 | -9999 | -9999 | -9999 | -9999 | -9999 | -9999 | -9999 | -9999 | -9999 | -9999 | -9999 | -9999 |
| 1980 | 1915 | 1188 | 677 | 833 | 638 | 474 | 50 | 394 | 365 | 401 | 543 | 1252 | 727.5 |
| 1981 | 1441 | -9999 | -9999 | 554 | 446 | 427 | 56 | 303 | 261 | 372 | 989 | 1287 | -9999 |
| 1982 | 1384 | 792 | 2108 | 1359 | 714 | 607 | 19 | 524 | 428 | 458 | 509 | 1206 | 842.33 |
| 1983 | 2682 | 1663 | 1535 | 1564 | 972 | 1602 | 63 | 663 | 1169 | 1488 | 1726 | 2258 | 1448.75 |
| |
|
|
|
|
|
|
|
|
|
|
|
|
|
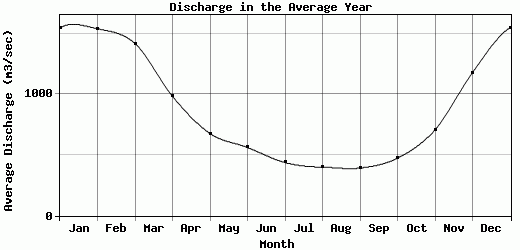
| Avg | 1545.47 | 1537.76 | 1416.94 | 981.82 | 675.8 | 561.29 | 437.35 | 399.45 | 391.96 | 473.56 | 706.15 | 1177.49 | 860.63 |
| |
|
|
|
|
|
|
|
|
|
|
|
|
|
| Std Dev | 690.18 |
806.23 |
672.31 |
368.42 |
235.96 |
229.46 |
182.4 |
142.63 |
161.94 |
204.27 |
266.64 |
421.31 |
279.08 |
| |
|
|
|
|
|
|
|
|
|
|
|
|
|
| | Jan | Feb | Mar | Apr | May | Jun | Jul | Aug | Sep | Oct | Nov | Dec | Avg Annual |
Click here for this table in tab-delimited format.
Tab-delimited format will open in most table browsing software, i.e. Excel, etc.
View this station on the map.
Return to start.