Results
| Country: | Uganda
| | Station: | MbararaWater Supply | | River: | Rwizi | | Area: | 2070 km2 | | Lat: | -0.61 | | Lon: | 30.65 | | Source: | RivDIS | | PointID: | 950 | | Area Units: | km2 | | Discharge Units: | m3/sec | | Starting Year: | 1976 | | Ending Year: | 1978 | | Total Years: | 3 | | Total Usable Years: | 3 | |
| |
| Year | Jan | Feb | Mar | Apr | May | Jun | Jul | Aug | Sep | Oct | Nov | Dec | Avg Annual |
|---|
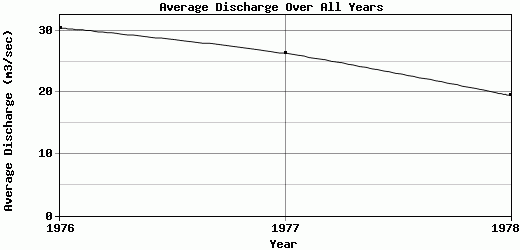
| 1976 | 29.5 | 27 | 27 | 32.5 | 32 | 32 | 27 | 27 | 27.5 | 31 | 35.5 | 37.5 | 30.46 |
| 1977 | 32.5 | 30 | 29 | 39.5 | 35.5 | 13.5 | 12 | 12 | 18 | 18 | 37 | 39 | 26.33 |
| 1978 | 15.5 | 12 | 32.5 | 11.5 | 21 | 12 | 10.5 | 10.5 | 18 | 31 | 29 | 30.5 | 19.5 |
| |
|
|
|
|
|
|
|
|
|
|
|
|
|
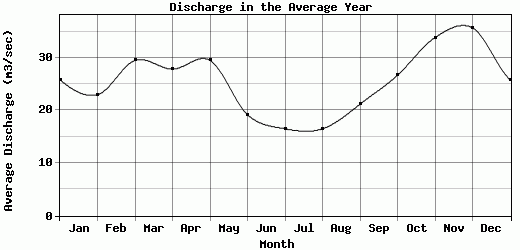
| Avg | 25.83 | 23 | 29.5 | 27.83 | 29.5 | 19.17 | 16.5 | 16.5 | 21.17 | 26.67 | 33.83 | 35.67 | 25.43 |
| |
|
|
|
|
|
|
|
|
|
|
|
|
|
| Std Dev | 7.41 |
7.87 |
2.27 |
11.9 |
6.18 |
9.1 |
7.45 |
7.45 |
4.48 |
6.13 |
3.47 |
3.7 |
4.52 |
| |
|
|
|
|
|
|
|
|
|
|
|
|
|
| | Jan | Feb | Mar | Apr | May | Jun | Jul | Aug | Sep | Oct | Nov | Dec | Avg Annual |
Click here for this table in tab-delimited format.
Tab-delimited format will open in most table browsing software, i.e. Excel, etc.
View this station on the map.
Return to start.