Results
| Country: | U.S.A.
| | Station: | BUCHANAN, TENN. | | River: | TENNESSEE RIVER | | Area: | 15642685.75 | | Lat: | 36.44 | | Lon: | -88.06 | | Source: | USGS | | PointID: | 3607500 | | Area Units: | km2 | | Discharge Units: | m3/sec | | Starting Year: | 1930 | | Ending Year: | 1942 | | Total Years: | 13 | | Total Usable Years: | 12 | |
| |
| Year | Jan | Feb | Mar | Apr | May | Jun | Jul | Aug | Sep | Oct | Nov | Dec | Avg Annual |
|---|
| 1930 | -9999 | -9999 | -9999 | -9999 | -9999 | -9999 | 388.11 | 379.54 | 372.56 | 336.06 | 584.27 | 722.45 | -9999 |
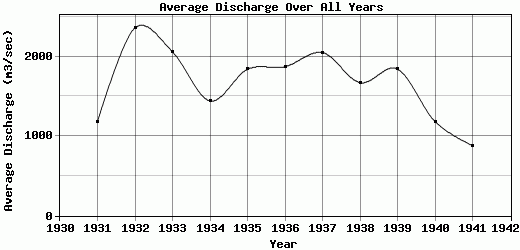
| 1931 | 1238.82 | 1271.03 | 1489.38 | 2874.84 | 1418.23 | 623.63 | 587.71 | 763.65 | 514.52 | 275.79 | 315.73 | 2806.67 | 1181.67 |
| 1932 | 3472.94 | 6882.98 | 2284.82 | 2999.9 | 2343.55 | 915.58 | 1658.37 | 720.99 | 544.82 | 1641.38 | 1345.34 | 3522.73 | 2361.12 |
| 1933 | 4703.09 | 5231.97 | 3591.05 | 3163.67 | 3266.14 | 910.2 | 721.99 | 721.54 | 797.78 | 407.58 | 396.63 | 796.71 | 2059.03 |
| 1934 | 1575.16 | 615.09 | 4995.12 | 2570.99 | 1018.22 | 1313.34 | 819.27 | 1160.08 | 706.32 | 812.15 | 763.05 | 971.64 | 1443.37 |
| 1935 | 2866.41 | 2548.33 | 4756.34 | 4500.89 | 2104.14 | 1120.22 | 687.28 | 660.06 | 507.63 | 352.55 | 1063.11 | 921.4 | 1840.7 |
| 1936 | 3742.14 | 3441.69 | 2694.13 | 5993.76 | 965.34 | 530.66 | 1008.91 | 592.56 | 578.89 | 738.25 | 859.61 | 1326.15 | 1872.67 |
| 1937 | 6980.6 | 4693.85 | 2041.56 | 1362.9 | 3033.3 | 905.01 | 796.07 | 784.29 | 830.16 | 972.1 | 902.46 | 1284.77 | 2048.92 |
| 1938 | 2463.21 | 1674.24 | 2755.06 | 3239.94 | 1465.54 | 1926.31 | 1585.66 | 1917.97 | 730.67 | 575.11 | 876.32 | 864.22 | 1672.85 |
| 1939 | 1722.59 | 6782.93 | 4432.62 | 2487.65 | 1401.97 | 1546.39 | 953.19 | 788.13 | 613.82 | 471.07 | 452.98 | 453.71 | 1842.25 |
| 1940 | 490.71 | 1602.84 | 2319.16 | 2374.38 | 1136.52 | 645.16 | 1149.58 | 1017.77 | 1016.3 | 670.56 | 789.95 | 962.14 | 1181.26 |
| 1941 | 1375.02 | 984.93 | 1007.35 | 1413.4 | 794.52 | 585.6 | 1116.88 | 847.59 | 632.04 | 595.02 | 566.72 | 652.2 | 880.94 |
| 1942 | 905.32 | 1596.27 | 2427.86 | 1599.44 | 646.91 | 684.52 | 791.14 | 1421.7 | 1126.36 | -9999 | -9999 | -9999 | -9999 |
| |
|
|
|
|
|
|
|
|
|
|
|
|
|
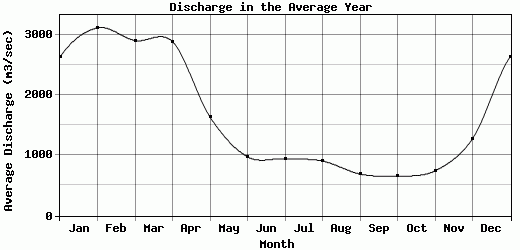
| Avg | 2628 | 3110.51 | 2899.54 | 2881.81 | 1632.87 | 975.55 | 943.4 | 905.84 | 690.14 | 653.97 | 743.01 | 1273.73 | 1671.34 |
| |
|
|
|
|
|
|
|
|
|
|
|
|
|
| Std Dev | 1785.45 |
2158.5 |
1223.83 |
1263.08 |
828.05 |
412.85 |
351.97 |
384.67 |
203.33 |
359.09 |
283.96 |
888.87 |
428.93 |
| |
|
|
|
|
|
|
|
|
|
|
|
|
|
| | Jan | Feb | Mar | Apr | May | Jun | Jul | Aug | Sep | Oct | Nov | Dec | Avg Annual |
Click here for this table in tab-delimited format.
Tab-delimited format will open in most table browsing software, i.e. Excel, etc.
View this station on the map.
Return to start.