Results
| Country: | U.S.A.
| | Station: | FRUITA, CO. | | River: | COLORADO RIVER | | Area: | 44286.37 | | Lat: | 39.14 | | Lon: | -108.72 | | Source: | USGS | | PointID: | 9153000 | | Area Units: | km2 | | Discharge Units: | m3/sec | | Starting Year: | 1970 | | Ending Year: | 1980 | | Total Years: | 11 | | Total Usable Years: | 10 | |
| |
| Year | Jan | Feb | Mar | Apr | May | Jun | Jul | Aug | Sep | Oct | Nov | Dec | Avg Annual |
|---|
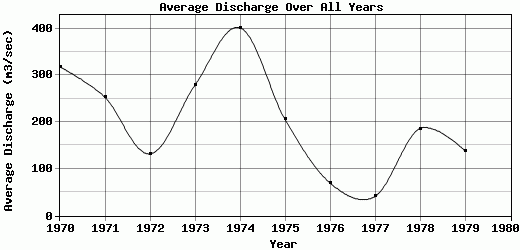
| 1970 | 1515.54 | 531.65 | 401.22 | 93.63 | 113.13 | 75.29 | 69.6 | 151.22 | 169.99 | 164.28 | 184.76 | 347.8 | 318.18 |
| 1971 | 376.76 | 166.81 | 372.09 | 349.79 | 241.51 | 299.28 | 199.29 | 249.97 | 270.75 | 132.48 | 160.27 | 221.57 | 253.38 |
| 1972 | 153.4 | 179.31 | 97.55 | 60.36 | 72.74 | 109.27 | 113.88 | 155.03 | 158.75 | 160.9 | 149.03 | 171.8 | 131.84 |
| 1973 | 605.52 | 455.68 | 377.26 | 140.74 | 124.31 | 94.37 | 120.16 | 152.93 | 150.22 | 140.44 | 512.73 | 472.99 | 278.95 |
| 1974 | 864.03 | 370.94 | 649.46 | 883.02 | 293.46 | 233.54 | 258.2 | 295.68 | 245.8 | 212.45 | 232.69 | 281.99 | 401.77 |
| 1975 | 180.81 | 195.99 | 193.17 | 188.62 | 277.35 | 234.16 | 185.81 | 202.5 | 185.5 | 159.83 | 207.64 | 260.11 | 205.96 |
| 1976 | 99.68 | 83.47 | 68.97 | 90.63 | 45.17 | 54.52 | 82.06 | 46.24 | 79.88 | 75.25 | 60.57 | 53.93 | 70.03 |
| 1977 | 45.01 | 37.82 | 31.08 | 62.37 | 28.55 | 36.05 | 53.53 | 43.82 | 34.39 | 30.73 | 33.5 | 52.69 | 40.79 |
| 1978 | 209.26 | 163.9 | 453.3 | 309.49 | 205.86 | 93.61 | 160.69 | 173.5 | 162.92 | 102.07 | 92.43 | 106.85 | 186.16 |
| 1979 | 147.52 | 227.48 | 204.53 | 76.04 | 108.88 | 109.73 | 157.19 | 159.84 | 121.77 | 107.36 | 102.65 | 144.67 | 138.97 |
| 1980 | -9999 | -9999 | -9999 | -9999 | -9999 | -9999 | -9999 | -9999 | -9999 | -9999 | -9999 | -9999 | -9999 |
| |
|
|
|
|
|
|
|
|
|
|
|
|
|
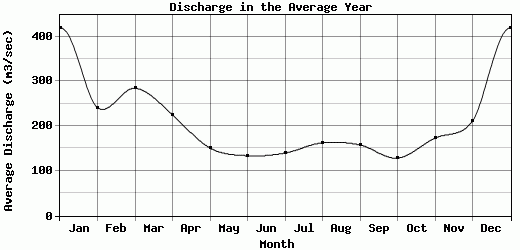
| Avg | 419.75 | 241.31 | 284.86 | 225.47 | 151.1 | 133.98 | 140.04 | 163.07 | 158 | 128.58 | 173.63 | 211.44 | 202.6 |
| |
|
|
|
|
|
|
|
|
|
|
|
|
|
| Std Dev | 438.61 |
151.99 |
187.6 |
239.83 |
91.49 |
84.27 |
60.97 |
74.15 |
66.41 |
49.05 |
128.29 |
127.06 |
107.02 |
| |
|
|
|
|
|
|
|
|
|
|
|
|
|
| | Jan | Feb | Mar | Apr | May | Jun | Jul | Aug | Sep | Oct | Nov | Dec | Avg Annual |
Click here for this table in tab-delimited format.
Tab-delimited format will open in most table browsing software, i.e. Excel, etc.
View this station on the map.
Return to start.