Results
| Country: | Canada
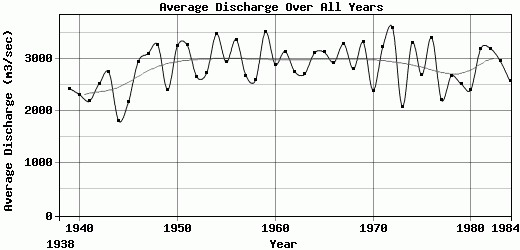
| | Station: | InternationalBoundary | | River: | Columbia | | Area: | 155000 km2 | | Lat: | 48.92 | | Lon: | -117.63 | | Source: | RivDIS | | PointID: | 275 | | Area Units: | km2 | | Discharge Units: | m3/sec | | Starting Year: | 1938 | | Ending Year: | 1984 | | Total Years: | 47 | | Total Usable Years: | 46 | |
| |
| Year | Jan | Feb | Mar | Apr | May | Jun | Jul | Aug | Sep | Oct | Nov | Dec | Avg Annual |
|---|
| 1938 | -9999 | -9999 | 893 | 1840 | 4970 | 8790 | 6070 | 2590 | 1950 | 1400 | 950 | 789 | -9999 |
| 1939 | 804 | 743 | 751 | 1760 | 5720 | 6010 | 4920 | 2860 | 1770 | 1310 | 1330 | 1160 | 2428.17 |
| 1940 | 876 | 833 | 1060 | 2010 | 4520 | 6110 | 4120 | 2520 | 2020 | 1610 | 1250 | 857 | 2315.5 |
| 1941 | 818 | 809 | 1020 | 1800 | 3560 | 4700 | 3580 | 2470 | 2140 | 1950 | 1580 | 1840 | 2188.92 |
| 1942 | 1410 | 1110 | 998 | 1520 | 3920 | 7130 | 5960 | 3240 | 1690 | 1290 | 1030 | 949 | 2520.58 |
| 1943 | 869 | 967 | 837 | 2930 | 4590 | 7120 | 7200 | 3450 | 1690 | 1310 | 1050 | 900 | 2742.75 |
| 1944 | 792 | 688 | 650 | 950 | 2690 | 5070 | 3260 | 2520 | 1730 | 1390 | 1130 | 869 | 1811.58 |
| 1945 | 829 | 858 | 893 | 1000 | 3480 | 7020 | 4950 | 2540 | 1530 | 1090 | 1000 | 889 | 2173.25 |
| 1946 | 921 | 910 | 1150 | 2040 | 6530 | 9160 | 6130 | 3210 | 1920 | 1210 | 995 | 1190 | 2947.17 |
| 1947 | 1090 | 1190 | 1440 | 2230 | 6960 | 8410 | 5720 | 2910 | 1790 | 2350 | 1910 | 1200 | 3100 |
| 1948 | 1150 | 1040 | 1060 | 1620 | 5850 | 13500 | 5920 | 3480 | 2120 | 1420 | 1130 | 935 | 3268.75 |
| 1949 | 898 | 846 | 956 | 1890 | 6510 | 6770 | 3540 | 2410 | 1580 | 1150 | 1090 | 1230 | 2405.83 |
| 1950 | 1000 | 1110 | 1420 | 1730 | 3910 | 9640 | 9510 | 3730 | 2080 | 1620 | 1580 | 1600 | 3244.17 |
| 1951 | 1730 | 1870 | 1500 | 2210 | 6680 | 7820 | 7250 | 3510 | 1940 | 1940 | 1420 | 1260 | 3260.83 |
| 1952 | 1100 | 1130 | 1100 | 2020 | 6350 | 6930 | 5160 | 2730 | 1570 | 1400 | 1360 | 939 | 2649.08 |
| 1953 | 913 | 1090 | 1060 | 1130 | 4090 | 8240 | 6220 | 3080 | 2110 | 1860 | 1690 | 1290 | 2731.08 |
| 1954 | 1010 | 1000 | 1380 | 1520 | 5360 | 9400 | 9590 | 4570 | 2870 | 1700 | 1750 | 1520 | 3472.5 |
| 1955 | 1200 | 1160 | 1100 | 1550 | 2840 | 8170 | 8510 | 3730 | 2020 | 1690 | 1760 | 1450 | 2931.67 |
| 1956 | 1340 | 1220 | 1410 | 3140 | 6810 | 10800 | 6170 | 3200 | 1920 | 1690 | 1490 | 1220 | 3367.5 |
| 1957 | 1040 | 1060 | 1180 | 1500 | 7310 | 7870 | 4070 | 2390 | 1660 | 1550 | 1400 | 1140 | 2680.83 |
| 1958 | 877 | 942 | 1350 | 1640 | 5490 | 8010 | 4230 | 2490 | 1740 | 1590 | 1450 | 1310 | 2593.25 |
| 1959 | 1480 | 1440 | 1280 | 2220 | 5290 | 9510 | 7470 | 3600 | 3060 | 2760 | 2330 | 1710 | 3512.5 |
| 1960 | 1210 | 1230 | 1530 | 3290 | 4550 | 7080 | 6440 | 3270 | 1830 | 1620 | 1630 | 1020 | 2891.67 |
| 1961 | 994 | 1510 | 1690 | 2280 | 5460 | 11900 | 5100 | 2870 | 1700 | 1620 | 1480 | 1070 | 3139.5 |
| 1962 | 1070 | 1330 | 1270 | 2280 | 4550 | 7140 | 5450 | 3430 | 1760 | 1590 | 1600 | 1560 | 2752.5 |
| 1963 | 1320 | 1620 | 1530 | 2110 | 3820 | 7430 | 5530 | 3150 | 1940 | 1560 | 1390 | 1040 | 2703.33 |
| 1964 | 1140 | 1040 | 1260 | 1520 | 3920 | 9930 | 7600 | 3670 | 2030 | 2150 | 1760 | 1260 | 3106.67 |
| 1965 | 1310 | 1540 | 1840 | 2420 | 5390 | 8350 | 5990 | 3910 | 2080 | 1710 | 1660 | 1340 | 3128.33 |
| 1966 | 1180 | 1180 | 1360 | 2430 | 4830 | 7770 | 6260 | 3270 | 2140 | 1810 | 1580 | 1330 | 2928.33 |
| 1967 | 1270 | 1530 | 1370 | 1450 | 3910 | 11000 | 7760 | 3540 | 2230 | 2100 | 1640 | 1610 | 3284.17 |
| 1968 | 1160 | 1300 | 1440 | 1810 | 2640 | 7790 | 6240 | 3380 | 2420 | 1990 | 1820 | 1620 | 2800.83 |
| 1969 | 1690 | 1650 | 1730 | 3550 | 6030 | 6970 | 5210 | 3040 | 3090 | 2150 | 2320 | 2350 | 3315 |
| 1970 | 2080 | 1120 | 1270 | 1260 | 3460 | 5190 | 3640 | 2820 | 2060 | 2000 | 1940 | 1870 | 2392.5 |
| 1971 | 1770 | 1830 | 1690 | 2130 | 6260 | 7730 | 5210 | 3650 | 1870 | 1870 | 2220 | 2470 | 3225 |
| 1972 | 2200 | 1600 | 2330 | 2770 | 5040 | 9600 | 6030 | 4050 | 2370 | 2280 | 2160 | 2670 | 3591.67 |
| 1973 | 2260 | 1780 | 1350 | 1610 | 2370 | 2830 | 3480 | 3110 | 2480 | 2250 | 1030 | 501 | 2087.58 |
| 1974 | 1843 | 2209 | 2172 | 2616 | 4842 | 6569 | 5210 | 3625 | 2832 | 2546 | 2659 | 2560 | 3306.92 |
| 1975 | 2610 | 2710 | 2130 | 2130 | 3040 | 4740 | 3160 | 2740 | 1750 | 2020 | 2560 | 2680 | 2689.17 |
| 1976 | 2910 | 2740 | 2480 | 2570 | 4910 | 4210 | 4670 | 5080 | 3340 | 2930 | 2420 | 2650 | 3409.17 |
| 1977 | 2590 | 1990 | 1920 | 1740 | 2720 | 2840 | 2540 | 2460 | 2150 | 1790 | 2230 | 1560 | 2210.83 |
| 1978 | 1780 | 1920 | 2000 | 2270 | 3560 | 3640 | 3510 | 2580 | 2870 | 2660 | 2490 | 2760 | 2670 |
| 1979 | 3330 | 2160 | 1720 | 1800 | 3540 | 3090 | 2620 | 2730 | 2040 | 2110 | 2120 | 2970 | 2519.17 |
| 1980 | 2110 | 1960 | 1490 | 1830 | 3570 | 3730 | 2940 | 2520 | 1710 | 1870 | 2170 | 3010 | 2409.17 |
| 1981 | 3500 | 3400 | 2300 | 1650 | 3710 | 5820 | 4880 | 3870 | 2230 | 2190 | 2160 | 2550 | 3188.33 |
| 1982 | 3120 | 2360 | 3010 | 3270 | 4500 | 5160 | 4730 | 3410 | 2300 | 2040 | 2210 | 2260 | 3197.5 |
| 1983 | 3000 | 3190 | 3140 | 2660 | 3730 | 3910 | 3620 | 3230 | 2060 | 1970 | 2170 | 2800 | 2956.67 |
| 1984 | 2860 | 3110 | 2260 | 1590 | 2970 | 3540 | 2790 | 3030 | 2000 | 2090 | 1860 | 2710 | 2567.5 |
| |
|
|
|
|
|
|
|
|
|
|
|
|
|
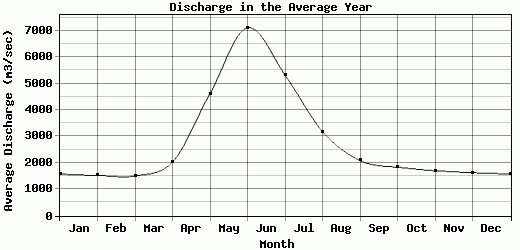
| Avg | 1575.09 | 1522.28 | 1505.74 | 2027.36 | 4611.74 | 7109.34 | 5322.55 | 3184.36 | 2088.98 | 1833.96 | 1701.15 | 1626.98 | 2843.86 |
| |
|
|
|
|
|
|
|
|
|
|
|
|
|
| Std Dev | 762.51 |
672.65 |
547.61 |
588.48 |
1299.11 |
2418.91 |
1706.08 |
574.74 |
419.78 |
416.19 |
470.78 |
695.95 |
425.97 |
| |
|
|
|
|
|
|
|
|
|
|
|
|
|
| | Jan | Feb | Mar | Apr | May | Jun | Jul | Aug | Sep | Oct | Nov | Dec | Avg Annual |
Click here for this table in tab-delimited format.
Tab-delimited format will open in most table browsing software, i.e. Excel, etc.
View this station on the map.
Return to start.