Results
| Country: | Italy
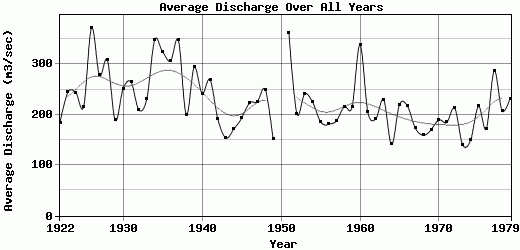
| | Station: | BoaraPisani | | River: | Adige | | Area: | 11954 km2 | | Lat: | 45.13 | | Lon: | 11.83 | | Source: | | | PointID: | 201 | | Area Units: | km2 | | Discharge Units: | m3/sec | | Starting Year: | 1922 | | Ending Year: | 1979 | | Total Years: | 58 | | Total Usable Years: | 57 | |
| |
| Year | Jan | Feb | Mar | Apr | May | Jun | Jul | Aug | Sep | Oct | Nov | Dec | Avg Annual |
|---|
| 1922 | 56 | 56 | 96 | 117 | 320 | 315 | 240 | 214 | 252 | 216 | 183 | 149 | 184.5 |
| 1923 | 133 | 99 | 99 | 194 | 383 | 433 | 399 | 255 | 208 | 273 | 230 | 229 | 244.58 |
| 1924 | 124 | 94 | 98 | 172 | 406 | 480 | 336 | 387 | 299 | 261 | 147 | 125 | 244.08 |
| 1925 | 90 | 127 | 116 | 176 | 449 | 408 | 298 | 299 | 197 | 159 | 162 | 111 | 216 |
| 1926 | 95 | 131 | 120 | 290 | 615 | 800 | 621 | 314 | 192 | 185 | 842 | 262 | 372.25 |
| 1927 | 175 | 148 | 173 | 233 | 363 | 466 | 411 | 321 | 318 | 221 | 297 | 212 | 278.17 |
| 1928 | 143 | 124 | 166 | 291 | 342 | 554 | 361 | 273 | 244 | 367 | 639 | 202 | 308.83 |
| 1929 | 136 | 111 | 127 | 122 | 249 | 347 | 231 | 284 | 183 | 155 | 164 | 156 | 188.75 |
| 1930 | 117 | 106 | 126 | 212 | 349 | 553 | 389 | 362 | 280 | 240 | 161 | 124 | 251.58 |
| 1931 | 106 | 124 | 161 | 180 | 483 | 556 | 331 | 317 | 281 | 185 | 283 | 170 | 264.75 |
| 1932 | 117 | 95 | 87.1 | 120 | 286 | 335 | 467 | 263 | 205 | 250 | 147 | 140 | 209.34 |
| 1933 | 108 | 97 | 111 | 130 | 240 | 377 | 392 | 396 | 227 | 284 | 242 | 174 | 231.5 |
| 1934 | 136 | 113 | 214 | 422 | 678 | 507 | 420 | 444 | 445 | 222 | 331 | 251 | 348.58 |
| 1935 | 161 | 138 | 146 | 164 | 470 | 773 | 434 | 288 | 235 | 457 | 381 | 246 | 324.42 |
| 1936 | 256 | 204 | 249 | 301 | 556 | 637 | 566 | 273 | 229 | 160 | 131 | 116 | 306.5 |
| 1937 | 102 | 110 | 201 | 283 | 512 | 683 | 427 | 366 | 543 | 461 | 279 | 204 | 347.58 |
| 1938 | 140 | 115 | 112 | 101 | 144 | 440 | 318 | 255 | 253 | 192 | 170 | 162 | 200.17 |
| 1939 | 158 | 137 | 112 | 169 | 374 | 532 | 420 | 372 | 405 | 340 | 326 | 181 | 293.83 |
| 1940 | 135 | 112 | 114 | 132 | 266 | 425 | 461 | 264 | 207 | 287 | 320 | 181 | 242 |
| 1941 | 148 | 149 | 152 | 303 | 374 | 715 | 430 | 319 | 196 | 146 | 179 | 125 | 269.67 |
| 1942 | 96 | 83 | 93 | 104 | 196 | 260 | 226 | 198 | 278 | 280 | 317 | 164 | 191.25 |
| 1943 | 123 | 112 | 96 | 118 | 199 | 208 | 215 | 175 | 177 | 196 | 121 | 109 | 154.08 |
| 1944 | 87 | 77 | 69 | 100 | 144 | 236 | 272 | 242 | 228 | 241 | 215 | 143 | 171.17 |
| 1945 | 115 | 98 | 126 | 222 | 290 | 310 | 219 | 313 | 211 | 140 | 151 | 122 | 193.08 |
| 1946 | 104 | 93 | 132 | 191 | 271 | 484 | 414 | 279 | 304 | 160 | 132 | 110 | 222.83 |
| 1947 | 100 | 105 | 186 | 345 | 446 | 347 | 367 | 227 | 173 | 150 | 125 | 143 | 226.17 |
| 1948 | 131 | 133 | 141 | 189 | 404 | 434 | 392 | 400 | 290 | 186 | 173 | 128 | 250.08 |
| 1949 | 118 | 102 | 98 | 128 | 202 | 261 | 187 | 154 | 162 | 119 | 144 | 137 | 151 |
| 1950 | -9999 | -9999 | -9999 | -9999 | -9999 | -9999 | -9999 | -9999 | -9999 | -9999 | -9999 | -9999 | -9999 |
| 1951 | 157 | 258 | 244 | 303 | 607 | 935 | 489 | 333 | 223 | 179 | 407 | 204 | 361.58 |
| 1952 | 144 | 129 | 114 | 164 | 213 | 227 | 187 | 198 | 246 | 330 | 283 | 194 | 202.42 |
| 1953 | 157 | 125 | 115 | 127 | 149 | 244 | 344 | 287 | 221 | 529 | 401 | 192 | 240.92 |
| 1954 | 144 | 137 | 152 | 165 | 263 | 578 | 333 | 240 | 214 | 172 | 133 | 170 | 225.08 |
| 1955 | 127 | 126 | 134 | 129 | 255 | 322 | 260 | 183 | 228 | 183 | 157 | 133 | 186.42 |
| 1956 | 117 | 114 | 114 | 186 | 216 | 310 | 259 | 201 | 185 | 185 | 150 | 135 | 181 |
| 1957 | 118 | 100 | 114 | 134 | 157 | 403 | 295 | 235 | 172 | 151 | 205 | 165 | 187.42 |
| 1958 | 140 | 154 | 149 | 203 | 312 | 297 | 258 | 246 | 181 | 224 | 220 | 209 | 216.08 |
| 1959 | 170 | 148 | 183 | 223 | 289 | 337 | 275 | 197 | 145 | 169 | 217 | 231 | 215.33 |
| 1960 | 176 | 181 | 221 | 229 | 312 | 400 | 322 | 271 | 500 | 608 | 512 | 326 | 338.17 |
| 1961 | 222 | 179 | 187 | 206 | 222 | 351 | 282 | 183 | 133 | 153 | 174 | 164 | 204.67 |
| 1962 | 153 | 138 | 141 | 173 | 293 | 429 | 248 | 180 | 125 | 132 | 166 | 122 | 191.67 |
| 1963 | 128 | 110 | 120 | 197 | 267 | 351 | 252 | 294 | 325 | 176 | 333 | 204 | 229.75 |
| 1964 | 137 | 113 | 136 | 183 | 196 | 200 | 123 | 100 | 79 | 152 | 137 | 136 | 141 |
| 1965 | 110 | 98 | 118 | 119 | 171 | 379 | 299 | 244 | 548 | 281 | 146 | 125 | 219.83 |
| 1966 | 106 | 118 | 117 | 124 | 200 | 185 | 196 | 440 | 268 | 250 | 428 | 179 | 217.58 |
| 1967 | 130 | 117 | 134 | 167 | 202 | 278 | 211 | 232 | 238 | 137 | 141 | 99 | 173.83 |
| 1968 | 75 | 88 | 100 | 141 | 221 | 360 | 203 | 164 | 181 | 114 | 168 | 101 | 159.67 |
| 1969 | 163 | 163 | 178 | 163 | 266 | 243 | 173 | 156 | 159 | 130 | 129 | 118 | 170.08 |
| 1970 | 130 | 147 | 124 | 151 | 246 | 329 | 221 | 250 | 235 | 154 | 160 | 127 | 189.5 |
| 1971 | 143 | 161 | 173 | 196 | 319 | 324 | 229 | 158 | 129 | 133 | 138 | 117 | 185 |
| 1972 | 120 | 140 | 159 | 220 | 246 | 456 | 433 | 229 | 163 | 143 | 123 | 120 | 212.67 |
| 1973 | 112 | 109 | 102 | 96.5 | 164 | 180 | 167 | 104 | 157 | 247 | 144 | 106 | 140.71 |
| 1974 | 104 | 116 | 144 | 152 | 194 | 225 | 217 | 126 | 161 | 138 | 110 | 100 | 148.92 |
| 1975 | 93.5 | 97.7 | 102 | 215 | 386 | 424 | 373 | 217 | 251 | 180 | 132 | 126 | 216.43 |
| 1976 | 104 | 100 | 91 | 94.5 | 103 | 90.5 | 96.5 | 89.5 | 295 | 439 | 395 | 165 | 171.92 |
| 1977 | 162 | 185 | 250 | 234 | 599 | 567 | 370 | 363 | 311 | 170 | 121 | 109 | 286.75 |
| 1978 | 133 | 128 | 192 | 162 | 308 | 449 | 382 | 221 | 126 | 176 | 113 | 102 | 207.67 |
| 1979 | 114 | 159 | 184 | 182 | 283 | 496 | 246 | 223 | 216 | 295 | 217 | 171 | 232.17 |
| |
|
|
|
|
|
|
|
|
|
|
|
|
|
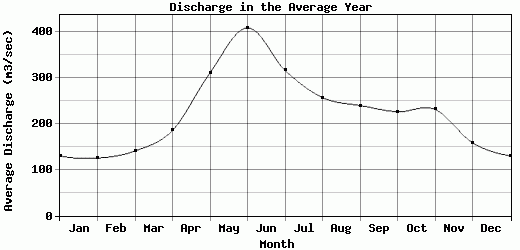
| Avg | 129.82 | 125.12 | 140.58 | 185.05 | 310 | 407.82 | 315.57 | 256.46 | 239.25 | 225.67 | 230.74 | 158.35 | 227.03 |
| |
|
|
|
|
|
|
|
|
|
|
|
|
|
| Std Dev | 32.59 |
33.15 |
42.3 |
67.06 |
131.02 |
164.66 |
107.52 |
81.93 |
95.21 |
104.34 |
137.25 |
47.58 |
57.29 |
| |
|
|
|
|
|
|
|
|
|
|
|
|
|
| | Jan | Feb | Mar | Apr | May | Jun | Jul | Aug | Sep | Oct | Nov | Dec | Avg Annual |
Click here for this table in tab-delimited format.
Tab-delimited format will open in most table browsing software, i.e. Excel, etc.
View this station on the map.
Return to start.