Results
| Country: | U.S.A.
| | Station: | Tulsa, OK | | River: | Arkansas River | | Area: | 193241.40 | | Lat: | 36.14 | | Lon: | -96 | | Source: | USGS | | PointID: | 7164500 | | Area Units: | km2 | | Discharge Units: | m3/sec | | Starting Year: | 1973 | | Ending Year: | 1993 | | Total Years: | 21 | | Total Usable Years: | 20 | |
| |
| Year | Jan | Feb | Mar | Apr | May | Jun | Jul | Aug | Sep | Oct | Nov | Dec | Avg Annual |
|---|
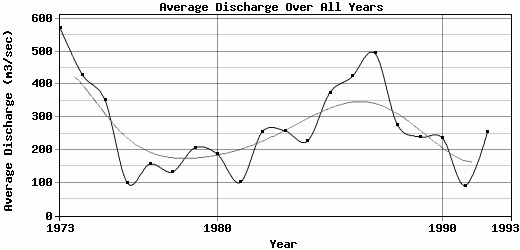
| 1973 | 342.28 | 362.56 | 1113.74 | 1328.44 | 836.94 | 278.77 | 102.25 | 145.5 | 135.97 | 1411.78 | 406.75 | 398.34 | 571.94 |
| 1974 | 292.59 | 304.22 | 710.25 | 335.79 | 514.95 | 675.01 | 192.32 | 138.95 | 355.07 | 168.56 | 1195.45 | 265.73 | 429.07 |
| 1975 | 326.6 | 544.63 | 569.46 | 358.03 | 617.74 | 1159.2 | 253.33 | 140.62 | 108.93 | 46.38 | 55.54 | 45.97 | 352.2 |
| 1976 | 49.82 | 46.66 | 56.13 | 141.23 | 238.09 | 184.42 | 252.86 | 92.37 | 35.76 | 33.53 | 31.06 | 28.06 | 99.17 |
| 1977 | 35.25 | 15.55 | 20.44 | 18.05 | 238.69 | 433.55 | 265.1 | 161.06 | 387.35 | 124.04 | 134.06 | 53.76 | 157.24 |
| 1978 | 82.27 | 114.18 | 242.71 | 177.47 | 255.33 | 409.97 | 139.93 | 53.19 | 41.67 | 16.31 | 31.1 | 36.48 | 133.38 |
| 1979 | 31.76 | 59.13 | 278.29 | 399.8 | 343.33 | 282.06 | 185.8 | 149.69 | 147.47 | 31.11 | 383.29 | 189.36 | 206.76 |
| 1980 | 109.39 | 126.4 | 192.74 | 466.85 | 555.09 | 440.46 | 200.48 | 37.3 | 56.07 | 18.83 | 18.3 | 22.72 | 187.05 |
| 1981 | 16.06 | 22.99 | 20.94 | 24.56 | 69.99 | 184.78 | 129.04 | 90.78 | 92.62 | 53.53 | 360.87 | 145.81 | 101 |
| 1982 | 80.99 | 164.55 | 247.51 | 99.41 | 762.78 | 905.29 | 502.8 | 165.25 | 63.2 | 29.45 | 22.2 | 25.54 | 255.75 |
| 1983 | 70.52 | 143.83 | 206.67 | 849.79 | 575.68 | 403.83 | 366.66 | 48.4 | 31.37 | 175.42 | 138.67 | 89.02 | 258.32 |
| 1984 | 70.29 | 100.79 | 486.17 | 1053.11 | 446.92 | 187.52 | 77.83 | 33.17 | 34.54 | 20.69 | 24.44 | 186.52 | 226.83 |
| 1985 | 308.36 | 261.02 | 645.54 | 347 | 498 | 432.62 | 177.62 | 111.16 | 154.23 | 841.38 | 373.27 | 348.72 | 374.91 |
| 1986 | 193.55 | 93.64 | 108.22 | 175.25 | 399.11 | 364.48 | 259.69 | 115.49 | 94.58 | 2138.02 | 793.44 | 357.99 | 424.45 |
| 1987 | 311.48 | 685.37 | 1443.98 | 640.45 | 327.74 | 887.74 | 621.96 | 205.36 | 217.19 | 232.66 | 96.8 | 259.94 | 494.22 |
| 1988 | 480.9 | 327.28 | 639.54 | 941.63 | 330.24 | 143.68 | 101.92 | 54.28 | 111.27 | 69.81 | 53.2 | 67.03 | 276.73 |
| 1989 | 64.59 | 149.93 | 132.05 | 198.89 | 151.35 | 516.93 | 302.13 | 297.29 | 670.83 | 228.15 | 107.48 | 52.91 | 239.38 |
| 1990 | 162.14 | 155.12 | 722.17 | 785.8 | 446.62 | 223.82 | 151.42 | 46.33 | 48.85 | 33.3 | 31.71 | 29.16 | 236.37 |
| 1991 | 46.95 | 37.57 | 24.11 | 55.17 | 143.15 | 179.69 | 47.31 | 34.96 | 87 | 68.46 | 123.81 | 244.49 | 91.06 |
| 1992 | 197.68 | 98.34 | 84.06 | 123.05 | 115.3 | 418.3 | 381.28 | 474.21 | 250.73 | 38.24 | 296.76 | 564.25 | 253.52 |
| 1993 | -9999 | -9999 | -9999 | -9999 | -9999 | -9999 | -9999 | -9999 | -9999 | -9999 | -9999 | -9999 | -9999 |
| |
|
|
|
|
|
|
|
|
|
|
|
|
|
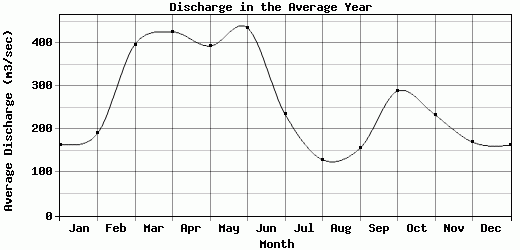
| Avg | 163.67 | 190.69 | 397.24 | 425.99 | 393.35 | 435.61 | 235.59 | 129.77 | 156.23 | 288.98 | 233.91 | 170.59 | 268.47 |
| |
|
|
|
|
|
|
|
|
|
|
|
|
|
| Std Dev | 131.61 |
172.94 |
380.8 |
372.21 |
206.81 |
269.34 |
141.08 |
102.71 |
154.28 |
538.7 |
293.09 |
151.5 |
131.33 |
| |
|
|
|
|
|
|
|
|
|
|
|
|
|
| | Jan | Feb | Mar | Apr | May | Jun | Jul | Aug | Sep | Oct | Nov | Dec | Avg Annual |
Click here for this table in tab-delimited format.
Tab-delimited format will open in most table browsing software, i.e. Excel, etc.
View this station on the map.
Return to start.