Results
| Country: | Somalia
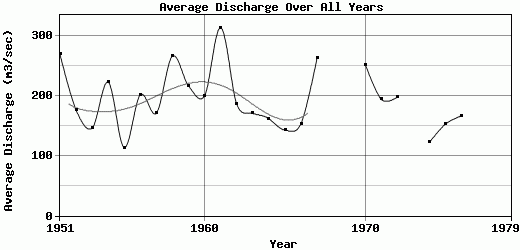
| | Station: | LughGanana | | River: | Juba | | Area: | 179520 km2 | | Lat: | 3.56 | | Lon: | 42.32 | | Source: | RivDIS | | PointID: | 1545 | | Area Units: | km2 | | Discharge Units: | m3/sec | | Starting Year: | 1951 | | Ending Year: | 1979 | | Total Years: | 29 | | Total Usable Years: | 26 | |
| |
| Year | Jan | Feb | Mar | Apr | May | Jun | Jul | Aug | Sep | Oct | Nov | Dec | Avg Annual |
|---|
| 1951 | 76.5 | 39.3 | 28.4 | 306 | 583 | 221 | 143 | 314 | 218 | 582 | 473 | 241 | 268.77 |
| 1952 | 64.2 | 19.6 | 12.7 | 61.3 | 221 | 78.7 | 97.1 | 228 | 379 | 602 | 303 | 43.6 | 175.85 |
| 1953 | 19.8 | 12.4 | 11 | 31.6 | 162 | 67.1 | 239 | 436 | 158 | 224 | 329 | 57.5 | 145.62 |
| 1954 | 25.4 | 12.4 | 10.8 | 211 | 193 | 140 | 269 | 489 | 510 | 589 | 134 | 81 | 222.05 |
| 1955 | 26.5 | 24.4 | 12.7 | 32.4 | 87 | 22.8 | 50.8 | 189 | 266 | 418 | 182 | 46.7 | 113.19 |
| 1956 | 35.5 | 23.5 | 12.7 | 87.2 | 237 | 98.8 | 135 | 315 | 342 | 786 | 281 | 62 | 201.31 |
| 1957 | 28.4 | 19.8 | 56 | 57.9 | 372 | 269 | 220 | 254 | 147 | 195 | 261 | 164 | 170.34 |
| 1958 | 36.2 | 41.7 | 28.4 | 27.8 | 119 | 669 | 326 | 476 | 452 | 463 | 316 | 231 | 265.51 |
| 1959 | 62 | 19.8 | 15.3 | 39.4 | 207 | 204 | 190 | 211 | 455 | 560 | 529 | 98.9 | 215.95 |
| 1960 | 38.5 | 175 | 430 | 39.7 | 15.3 | 176 | 241 | 170 | 224 | 281 | 382 | 223 | 199.63 |
| 1961 | 29.9 | 24.8 | 24.3 | 226 | 225 | 163 | 225 | 515 | 406 | 634 | 808 | 469 | 312.5 |
| 1962 | 78.8 | 29.3 | 22.8 | 55.9 | 189 | 463 | 72.1 | 173 | 235 | 508 | 281 | 115 | 185.24 |
| 1963 | 18.3 | 16.1 | 20.9 | 283 | 501 | 175 | 127 | 146 | 122 | 182 | 189 | 260 | 170.03 |
| 1964 | 81 | 37.1 | 24.3 | 57.5 | 75.8 | 96.8 | 99.3 | 253 | 245 | 510 | 315 | 140 | 161.23 |
| 1965 | 127 | 37.6 | 8.59 | 10.8 | 30.2 | 13.9 | 24.6 | 49.3 | 90.7 | 624 | 495 | 196 | 142.31 |
| 1966 | 50.8 | 31 | 32.5 | 75.2 | 210 | 151 | 126 | 185 | 347 | 258 | 276 | 97.1 | 153.3 |
| 1967 | 29.5 | 23.6 | 26.1 | 81.8 | 253 | 50.9 | 167 | 380 | 346 | 690 | 785 | 319 | 262.66 |
| 1968 | -9999 | -9999 | -9999 | -9999 | -9999 | -9999 | -9999 | -9999 | -9999 | -9999 | -9999 | -9999 | -9999 |
| 1969 | -9999 | -9999 | -9999 | -9999 | -9999 | -9999 | -9999 | -9999 | -9999 | -9999 | 166 | 57.9 | -9999 |
| 1970 | 60.9 | 56.6 | 105 | 243 | 188 | 330 | 171 | 246 | 374 | 646 | 522 | 73.2 | 251.31 |
| 1971 | 36.2 | 27.7 | 27.6 | 60.2 | 195 | 163 | 228 | 212 | 246 | 596 | 406 | 123 | 193.39 |
| 1972 | 51.5 | 47.1 | 53.8 | 113 | 307 | 217 | 219 | 256 | 230 | 329 | 411 | 135 | 197.45 |
| 1973 | 53.8 | 31.8 | 19.4 | -9999 | 27.6 | 15.8 | 22.8 | 287 | -9999 | 453 | 261 | 7.47 | -9999 |
| 1974 | 1.12 | 0 | 0 | 15.8 | 79.5 | 183 | 161 | 227 | 381 | 230 | 169 | 20.9 | 122.36 |
| 1975 | 4.48 | 7.44 | 5.23 | 28.5 | 68 | 35.5 | 208 | 422 | 378 | 392 | 250 | 32.9 | 152.67 |
| 1976 | 15.7 | 5.99 | 8.21 | 22.8 | 416 | 275 | 214 | 186 | 215 | 219 | 364 | 52.6 | 166.19 |
| 1977 | 21.07 | 27.3 | 14.2 | 240 | 330 | 358 | 211 | 318 | 483 | -9999 | -9999 | -9999 | -9999 |
| 1978 | 24.6 | 13.2 | 21.3 | 111 | 298 | 67.5 | 370 | 369 | 334 | -9999 | 338 | 128 | -9999 |
| 1979 | 29.1 | -9999 | -9999 | -9999 | -9999 | -9999 | -9999 | -9999 | -9999 | -9999 | -9999 | -9999 | -9999 |
| |
|
|
|
|
|
|
|
|
|
|
|
|
|
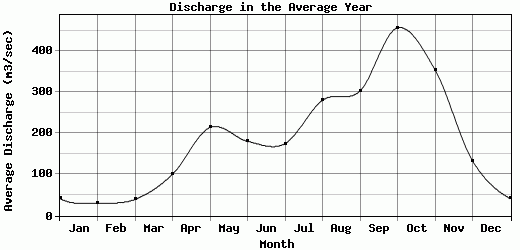
| Avg | 41.73 | 30.94 | 39.7 | 100.75 | 214.98 | 180.95 | 175.26 | 281.01 | 303.35 | 457.13 | 354.85 | 133.68 | 193.43 |
| |
|
|
|
|
|
|
|
|
|
|
|
|
|
| Std Dev | 27.01 |
31.56 |
80.71 |
89.9 |
140.36 |
147.15 |
83.83 |
114.77 |
113.54 |
176.35 |
166.14 |
104.47 |
50.01 |
| |
|
|
|
|
|
|
|
|
|
|
|
|
|
| | Jan | Feb | Mar | Apr | May | Jun | Jul | Aug | Sep | Oct | Nov | Dec | Avg Annual |
Click here for this table in tab-delimited format.
Tab-delimited format will open in most table browsing software, i.e. Excel, etc.
View this station on the map.
Return to start.