Results
| Country: | Spain
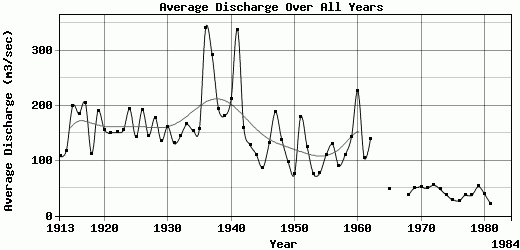
| | Station: | Masiadel Mompo | | River: | Jucar | | Area: | 17876 km2 | | Lat: | 39.11 | | Lon: | -0.65 | | Source: | RivDIS | | PointID: | 195 | | Area Units: | km2 | | Discharge Units: | m3/sec | | Starting Year: | 1913 | | Ending Year: | 1984 | | Total Years: | 72 | | Total Usable Years: | 68 | |
| |
| Year | Jan | Feb | Mar | Apr | May | Jun | Jul | Aug | Sep | Oct | Nov | Dec | Avg Annual |
|---|
| 1913 | 116 | 69 | 108 | 159 | 114 | 101 | 74 | 53 | 128 | 146 | 138 | 91 | 108.08 |
| 1914 | 88 | 103 | 169 | 127 | 130 | 106 | 85 | 105 | 80 | 80 | 96 | 245 | 117.83 |
| 1915 | 389 | 253 | 343 | 237 | 257 | 191 | 112 | 99 | 112 | 100 | 107 | 187 | 198.92 |
| 1916 | 124 | 140 | 414 | 225 | 144 | 102 | 88 | 85 | 91 | 92 | 105 | 610 | 185 |
| 1917 | 230 | 325 | 359 | 257 | 245 | 243 | 157 | 126 | 141 | 131 | 106 | 135 | 204.58 |
| 1918 | 136 | 115 | 109 | 194 | 150 | 113 | 79 | 77 | 86 | 82 | 107 | 99 | 112.25 |
| 1919 | 130 | 331 | 222 | 290 | 166 | 116 | 116 | 77 | 119 | 275 | 254 | 191 | 190.58 |
| 1920 | 197 | 231 | 268 | 194 | 150 | 136 | 127 | 100 | 96 | 113 | 121 | 144 | 156.42 |
| 1921 | 136 | 114 | 109 | 116 | 289 | 266 | 151 | 105 | 172 | 110 | 102 | 129 | 149.92 |
| 1922 | 155 | 216 | 196 | 299 | 153 | 208 | 94 | 78 | 99 | 99 | 97 | 120 | 151.17 |
| 1923 | 120 | 147 | 144 | 127 | 112 | 126 | 231 | 107 | 80 | 284 | 181 | 200 | 154.92 |
| 1924 | 157 | 340 | 467 | 353 | 206 | 149 | 107 | 101 | 117 | 109 | 107 | 109 | 193.5 |
| 1925 | 101 | 152 | 196 | 167 | 159 | 167 | 144 | 100 | 105 | 116 | 76 | 220 | 141.92 |
| 1926 | 170 | 293 | 172 | 188 | 191 | 133 | 118 | 102 | 108 | 136 | 483 | 209 | 191.92 |
| 1927 | 179 | 155 | 183 | 163 | 155 | 136 | 110 | 112 | 93 | 122 | 113 | 223 | 145.33 |
| 1928 | 205 | 133 | 335 | 320 | 235 | 156 | 113 | 124 | 160 | 125 | 119 | 113 | 178.17 |
| 1929 | 133 | 153 | 160 | 122 | 166 | 182 | 118 | 112 | 124 | 116 | 115 | 121 | 135.17 |
| 1930 | 137 | 241 | 257 | 200 | 194 | 230 | 135 | 97 | 92 | 103 | 113 | 143 | 161.83 |
| 1931 | 155 | 124 | 196 | 141 | 122 | 110 | 106 | 99 | 91 | 107 | 175 | 146 | 131 |
| 1932 | 140 | 136 | 200 | 157 | 145 | 145 | 109 | 122 | 123 | 112 | 120 | 216 | 143.75 |
| 1933 | 209 | 199 | 226 | 172 | 159 | 195 | 126 | 103 | 183 | 124 | 122 | 169 | 165.58 |
| 1934 | 162 | 159 | 196 | 246 | 182 | 141 | 105 | 109 | 116 | 107 | 125 | 203 | 154.25 |
| 1935 | 188 | 137 | 215 | 126 | 200 | 190 | 126 | 119 | 92 | 114 | 123 | 261 | 157.58 |
| 1936 | 457 | 433 | 608 | 452 | 541 | 369 | 220 | 173 | 276 | 174 | 199 | 191 | 341.08 |
| 1937 | 288 | 317 | 582 | 290 | 193 | 215 | 148 | 161 | 174 | 384 | 439 | 308 | 291.58 |
| 1938 | 325 | 215 | 220 | 190 | 200 | 178 | 158 | 150 | 181 | 205 | 150 | 162 | 194.5 |
| 1939 | 189 | 168 | 176 | 174 | 160 | 166 | 151 | 162 | 164 | 235 | 238 | 196 | 181.58 |
| 1940 | 313 | 364 | 261 | 177 | 190 | 195 | 179 | 166 | 128 | 180 | 202 | 180 | 211.25 |
| 1941 | 574 | 630 | 553 | 377 | 450 | 266 | 226 | 195 | 214 | 196 | 184 | 187 | 337.67 |
| 1942 | 172 | 125 | 194 | 236 | 226 | 169 | 155 | 144 | 145 | 112 | 114 | 122 | 159.5 |
| 1943 | 151 | 147 | 141 | 113 | 118 | 113 | 124 | 116 | 129 | 155 | 113 | 118 | 128.17 |
| 1944 | 117 | 109 | 114 | 112 | 121 | 126 | 114 | 112 | 107 | 102 | 103 | 88 | 110.42 |
| 1945 | 90 | 99 | 106 | 93 | 87 | 88 | 85 | 88 | 84 | 50 | 56 | 118 | 87 |
| 1946 | 97 | 75 | 120 | 185 | 450 | 126 | 99 | 70 | 95 | 79 | 71 | 105 | 131 |
| 1947 | 90 | 352 | 646 | 307 | 162 | 118 | 110 | 102 | 77 | 96 | 86 | 115 | 188.42 |
| 1948 | 242 | 233 | 186 | 160 | 145 | 128 | 96 | 90 | 93 | 77 | 88 | 115 | 137.75 |
| 1949 | 120 | 80 | 84 | 94 | 89 | 79 | 74 | 80 | 146 | 156 | 75 | 94 | 97.58 |
| 1950 | 106 | 84 | 69 | 79 | 80 | 66 | 61 | 70 | 70 | 58 | 51 | 108 | 75.17 |
| 1951 | 120 | 217 | 446 | 206 | 278 | 124 | 117 | 126 | 136 | 110 | 141 | 138 | 179.92 |
| 1952 | 133 | 146 | 126 | 272 | 149 | 104 | 119 | 120 | 81 | 80 | 71 | 91 | 124.33 |
| 1953 | 95 | 93 | 84 | 70 | 58 | 71 | 87 | 88 | 54 | 77 | 63 | 68 | 75.67 |
| 1954 | 97 | 64 | 109 | 80 | 92 | 80 | 75 | 69 | 67 | 72 | 66 | 55 | 77.17 |
| 1955 | 117 | 272 | 130 | 89 | 99 | 77 | 55 | 62 | 80 | 81 | 85 | 173 | 110 |
| 1956 | 194 | 98 | 235 | 208 | 189 | 139 | 98 | 76 | 78 | 75 | 70 | 94 | 129.5 |
| 1957 | 76 | 93 | 96 | 85 | 139 | 127 | 51 | 63 | 73 | 115 | 91 | 77 | 90.5 |
| 1958 | 111 | 105 | 116 | 186 | 93 | 91 | 85 | 82 | 93 | 91 | 80 | 192 | 110.42 |
| 1959 | 165 | 133 | 176 | 145 | 161 | 138 | 107 | 102 | 104 | 81 | 72 | 333 | 143.08 |
| 1960 | 374 | 537 | 444 | 319 | 116 | 146 | 130 | 57 | 70 | 173 | 204 | 140 | 225.83 |
| 1961 | 194 | 131 | 111 | 100 | 76 | 77 | 56 | 81 | 72 | 86 | 124 | 148 | 104.67 |
| 1962 | 245 | 117 | 298 | 167 | 169 | 137 | 75 | 87 | 88 | 88 | 109 | 97 | 139.75 |
| 1963 | -9999 | -9999 | -9999 | -9999 | -9999 | -9999 | -9999 | -9999 | -9999 | -9999 | -9999 | -9999 | -9999 |
| 1964 | -9999 | -9999 | -9999 | -9999 | -9999 | -9999 | -9999 | -9999 | -9999 | -9999 | -9999 | -9999 | -9999 |
| 1965 | 41 | 53 | 48 | 47 | 52 | 50 | 44 | 40 | 35 | 58 | 70 | 51 | 49.08 |
| 1966 | 88 | 107 | -9999 | -9999 | -9999 | 68 | 50 | 47 | 47 | 57 | 1 | 52 | -9999 |
| 1967 | 56 | 58 | -9999 | 50 | 44 | 46 | 47 | 47 | 44 | 44 | 39 | 35 | -9999 |
| 1968 | 31 | 49 | 47 | 37 | 41 | 39 | 43 | 38 | 39 | 29 | 26 | 31 | 37.5 |
| 1969 | 40 | 41 | 97 | 51 | 44 | 42 | 44 | 44 | 41 | 67 | 47 | 44 | 50.17 |
| 1970 | 82 | 60 | 56 | 46 | 50 | 51 | 49 | 48 | 47 | 47 | 48 | 40 | 52 |
| 1971 | 41 | 41 | 45 | 43 | 57 | 44 | 42 | 58 | 44 | 65 | 54 | 67 | 50.08 |
| 1972 | 62 | 61 | 47 | 44 | 49 | 50 | 50 | 52 | 51 | 57 | 70 | 70 | 55.25 |
| 1973 | 60.9 | 57.9 | 52.1 | 48.9 | 49.3 | 43.3 | 41.8 | 41 | 42.1 | 39.2 | 45.3 | 49.8 | 47.63 |
| 1974 | 45.9 | 41.6 | 42 | 43.1 | 38.8 | 37.4 | 40.2 | 41 | 33.8 | 31 | 28 | 25.2 | 37.33 |
| 1975 | 24.3 | 21.4 | 21.2 | 18.9 | 30.9 | 28 | 43.4 | 37.6 | 28.4 | 23.9 | 25.1 | 41.1 | 28.68 |
| 1976 | 20 | 19.5 | 21.5 | 30 | 25 | 33 | 40 | 37.5 | 26.5 | 23 | 23 | 21.5 | 26.71 |
| 1977 | 21 | 22 | 30.5 | 37 | 37.5 | 36 | 43.5 | 41.5 | 47 | 41.5 | 46 | 45 | 37.38 |
| 1978 | 28.5 | 32.5 | 37 | 45.5 | 42 | 40 | 42.5 | 41 | 39.5 | 40 | 26.5 | 29.5 | 37.04 |
| 1979 | 41 | 45.5 | 53 | 57 | 63 | 55.5 | 60 | 58 | 54 | 44.5 | 52 | 50.5 | 52.83 |
| 1980 | 49.5 | 46.5 | 40.5 | 38.5 | 38.5 | 38 | 38.5 | 38.5 | 35.5 | 38.5 | 38.5 | 26 | 38.92 |
| 1981 | 21.5 | 29 | 24 | 17.5 | 25 | 25.5 | 29 | 24.5 | 17 | 13.5 | 12 | 11 | 20.79 |
| 1982 | 12 | 7.8 | 10 | 10 | 28.5 | 20.5 | 23.5 | 20 | 7.7 | -9999 | -9999 | -9999 | -9999 |
| 1983 | -9999 | -9999 | -9999 | -9999 | -9999 | -9999 | -9999 | -9999 | -9999 | -9999 | -9999 | -9999 | -9999 |
| 1984 | -9999 | -9999 | -9999 | -9999 | 21.5 | 24.5 | 32.5 | 36 | 24 | 19.5 | 30 | 8.8 | -9999 |
| |
|
|
|
|
|
|
|
|
|
|
|
|
|
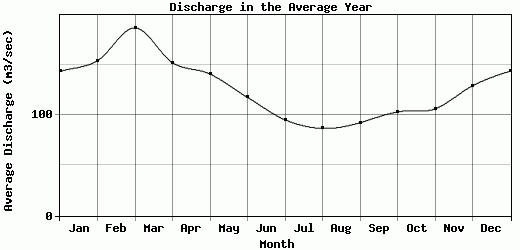
| Avg | 143.74 | 154.36 | 187.07 | 152.39 | 141.06 | 117.78 | 95.51 | 86.88 | 92.62 | 103.38 | 106.34 | 129.34 | 129.76 |
| |
|
|
|
|
|
|
|
|
|
|
|
|
|
| Std Dev | 105.12 |
122.45 |
150.93 |
98.94 |
99.64 |
68.83 |
47.4 |
38.62 |
49.92 |
65.34 |
81.34 |
92.64 |
69.32 |
| |
|
|
|
|
|
|
|
|
|
|
|
|
|
| | Jan | Feb | Mar | Apr | May | Jun | Jul | Aug | Sep | Oct | Nov | Dec | Avg Annual |
Click here for this table in tab-delimited format.
Tab-delimited format will open in most table browsing software, i.e. Excel, etc.
View this station on the map.
Return to start.