Results
| Country: | U.S.S.R.
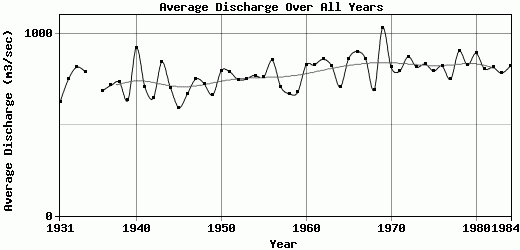
| | Station: | Kluchi | | River: | Kamchatka | | Area: | 45600 km2 | | Lat: | 56.63 | | Lon: | 161.05 | | Source: | RivDIS | | PointID: | 938 | | Area Units: | km2 | | Discharge Units: | m3/sec | | Starting Year: | 1931 | | Ending Year: | 1984 | | Total Years: | 54 | | Total Usable Years: | 53 | |
| |
| Year | Jan | Feb | Mar | Apr | May | Jun | Jul | Aug | Sep | Oct | Nov | Dec | Avg Annual |
|---|
| 1931 | 388 | 295 | 333 | 349 | 620 | 1650 | 1110 | 736 | 636 | 579 | 425 | 360 | 623.42 |
| 1932 | 342 | 323 | 367 | 423 | 613 | 1640 | 1740 | 1130 | 858 | 694 | 517 | 377 | 752 |
| 1933 | 366 | 356 | 386 | 461 | 816 | 1690 | 1720 | 1480 | 901 | 719 | 530 | 400 | 818.75 |
| 1934 | 357 | 314 | 358 | 427 | 819 | 1920 | 1860 | 1040 | 822 | 657 | 502 | 412 | 790.67 |
| 1935 | 366 | 329 | -9999 | -9999 | -9999 | -9999 | -9999 | 897 | 687 | 637 | 466 | 373 | -9999 |
| 1936 | 330 | 331 | 349 | 400 | 619 | 1570 | 1420 | 973 | 783 | 649 | 465 | 344 | 686.08 |
| 1937 | 320 | 354 | 354 | 416 | 664 | 1300 | 1930 | 1040 | 740 | 701 | 422 | 368 | 717.42 |
| 1938 | 330 | 322 | 306 | 353 | 682 | 1750 | 1910 | 907 | 845 | 615 | 447 | 363 | 735.83 |
| 1939 | 374 | 373 | 366 | 376 | 838 | 1290 | 826 | 828 | 772 | 697 | 479 | 396 | 634.58 |
| 1940 | 448 | 387 | 362 | 398 | 1190 | 1690 | 2110 | 1540 | 1240 | 889 | 469 | 378 | 925.08 |
| 1941 | 412 | 396 | 390 | 445 | 743 | 1410 | 1680 | 926 | 726 | 575 | 429 | 364 | 708 |
| 1942 | 399 | 348 | 334 | 350 | 739 | 1160 | 1530 | 876 | 646 | 539 | 438 | 410 | 647.42 |
| 1943 | 359 | 352 | 397 | 432 | 821 | 1790 | 2030 | 1180 | 954 | 786 | 599 | 452 | 846 |
| 1944 | 346 | 320 | 319 | 322 | 814 | 1670 | 1320 | 920 | 682 | 714 | 598 | 442 | 705.58 |
| 1945 | 374 | 385 | 381 | 520 | 897 | 1240 | 909 | 667 | 577 | 509 | 369 | 312 | 595 |
| 1946 | 311 | 325 | 335 | 341 | 700 | 1300 | 1540 | 1020 | 750 | 628 | 374 | 419 | 670.25 |
| 1947 | 393 | 373 | 370 | 411 | 685 | 1170 | 2070 | 1310 | 801 | 590 | 452 | 402 | 752.25 |
| 1948 | 406 | 405 | 412 | 485 | 968 | 1650 | 1170 | 817 | 735 | 698 | 521 | 426 | 724.42 |
| 1949 | 397 | 396 | 405 | 458 | 897 | 1660 | 1170 | 771 | 637 | 507 | 341 | 338 | 664.75 |
| 1950 | 423 | 407 | 386 | 410 | 776 | 1640 | 1980 | 1140 | 855 | 704 | 476 | 385 | 798.5 |
| 1951 | 429 | 425 | 392 | 469 | 875 | 1770 | 1940 | 1030 | 716 | 669 | 396 | 397 | 792.33 |
| 1952 | 378 | 373 | 368 | 401 | 750 | 1090 | 1980 | 1050 | 880 | 832 | 448 | 423 | 747.75 |
| 1953 | 434 | 394 | 401 | 435 | 726 | 1280 | 1850 | 1180 | 826 | 686 | 420 | 420 | 754.33 |
| 1954 | 420 | 417 | 394 | 498 | 784 | 1490 | 2030 | 1040 | 735 | 631 | 432 | 390 | 771.75 |
| 1955 | 391 | 388 | 389 | 415 | 843 | 1890 | 1780 | 907 | 652 | 619 | 458 | 431 | 763.58 |
| 1956 | 460 | 419 | 398 | 550 | 932 | 1760 | 2170 | 1170 | 780 | 680 | 473 | 470 | 855.17 |
| 1957 | 445 | 399 | 376 | 414 | 813 | 1550 | 1550 | 868 | 671 | 608 | 449 | 372 | 709.58 |
| 1958 | 393 | 360 | 364 | 385 | 663 | 1690 | 1420 | 808 | 630 | 575 | 392 | 377 | 671.42 |
| 1959 | 373 | 381 | 373 | 413 | 959 | 1560 | 1370 | 826 | 603 | 553 | 402 | 345 | 679.83 |
| 1960 | 393 | 370 | 377 | 417 | 725 | 1140 | 2400 | 1350 | 993 | 821 | 538 | 449 | 831.08 |
| 1961 | 430 | 421 | 405 | 480 | 826 | 1500 | 2460 | 1080 | 809 | 693 | 419 | 437 | 830 |
| 1962 | 420 | 416 | 419 | 571 | 1030 | 2110 | 1700 | 1180 | 829 | 749 | 444 | 469 | 861.42 |
| 1963 | 478 | 437 | 431 | 487 | 854 | 1550 | 2090 | 1050 | 795 | 741 | 547 | 437 | 824.75 |
| 1964 | 435 | 422 | 414 | 445 | 909 | 1760 | 1120 | 907 | 679 | 572 | 423 | 405 | 707.58 |
| 1965 | 392 | 398 | 385 | 437 | 987 | 1540 | 2410 | 1260 | 858 | 811 | 448 | 454 | 865 |
| 1966 | 469 | 445 | 418 | 495 | 919 | 1980 | 1970 | 1300 | 1030 | 820 | 523 | 480 | 904.08 |
| 1967 | 466 | 464 | 443 | 480 | 1280 | 2370 | 1310 | 1130 | 788 | 734 | 470 | 414 | 862.42 |
| 1968 | 476 | 432 | 425 | 481 | 1030 | 1610 | 1050 | 763 | 610 | 617 | 379 | 420 | 691.08 |
| 1969 | 420 | 407 | 401 | 411 | 849 | 1890 | 2720 | 1820 | 1350 | 1090 | 528 | 527 | 1034.42 |
| 1970 | 557 | 521 | 521 | 570 | 1120 | 1680 | 1230 | 851 | 946 | 840 | 479 | 494 | 817.42 |
| 1971 | 482 | 461 | 446 | 467 | 921 | 1840 | 1640 | 949 | 801 | 670 | 395 | 471 | 795.25 |
| 1972 | 473 | 445 | 445 | 495 | 1040 | 1880 | 1920 | 1220 | 960 | 721 | 429 | 483 | 875.92 |
| 1973 | 447 | 444 | 438 | 453 | 914 | 1840 | 1730 | 1080 | 852 | 711 | 445 | 459 | 817.75 |
| 1974 | 447 | 462 | 453 | 493 | 842 | 1830 | 2000 | 1010 | 795 | 698 | 500 | 499 | 835.75 |
| 1975 | 439 | 426 | 400 | 466 | 848 | 1920 | 1500 | 1000 | 870 | 791 | 464 | 434 | 796.5 |
| 1976 | 455 | 439 | 419 | 528 | 879 | 1850 | 2080 | 1070 | 736 | 632 | 415 | 388 | 824.25 |
| 1977 | 401 | 377 | 378 | 451 | 850 | 1760 | 1130 | 955 | 924 | 882 | 410 | 494 | 751 |
| 1978 | 435 | 416 | 418 | 478 | 986 | 1640 | 2130 | 1200 | 966 | 1040 | 649 | 518 | 906.33 |
| 1979 | 502 | 477 | 444 | 478 | 981 | 1600 | 1580 | 1100 | 981 | 802 | 501 | 495 | 828.42 |
| 1980 | 479 | 458 | 450 | 451 | 976 | 1810 | 2400 | 1210 | 852 | 780 | 396 | 471 | 894.42 |
| 1981 | 427 | 437 | 410 | 445 | 1130 | 1790 | 1190 | 868 | 854 | 997 | 667 | 476 | 807.58 |
| 1982 | 483 | 460 | 431 | 516 | 1140 | 1370 | 1540 | 1060 | 910 | 767 | 591 | 533 | 816.75 |
| 1983 | 519 | 480 | 456 | 493 | 861 | 1740 | 1690 | 986 | 694 | 594 | 457 | 448 | 784.83 |
| 1984 | 450 | 417 | 416 | 480 | 895 | 2090 | 1540 | 954 | 796 | 815 | 584 | 430 | 822.25 |
| |
|
|
|
|
|
|
|
|
|
|
|
|
|
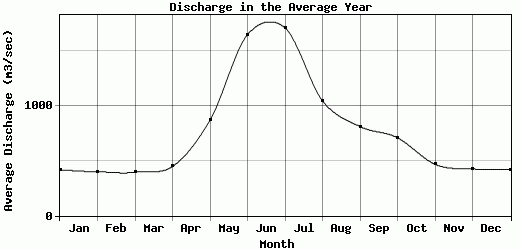
| Avg | 417.39 | 399.61 | 396.38 | 447.64 | 868.64 | 1648.3 | 1710.28 | 1045 | 811.44 | 709.78 | 468.33 | 424.65 | 779.77 |
| |
|
|
|
|
|
|
|
|
|
|
|
|
|
| Std Dev | 51.94 |
48.72 |
39.31 |
55.13 |
146.51 |
260.24 |
423.7 |
209.22 |
145.04 |
122.94 |
69.29 |
51.1 |
85.74 |
| |
|
|
|
|
|
|
|
|
|
|
|
|
|
| | Jan | Feb | Mar | Apr | May | Jun | Jul | Aug | Sep | Oct | Nov | Dec | Avg Annual |
Click here for this table in tab-delimited format.
Tab-delimited format will open in most table browsing software, i.e. Excel, etc.
View this station on the map.
Return to start.