Results
| Country: | Malaysia
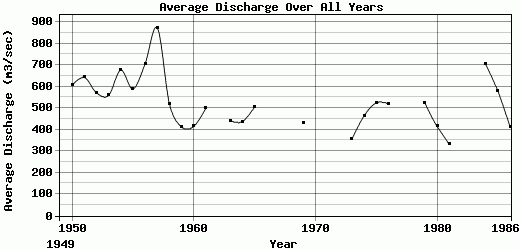
| | Station: | GuillemardBridge | | River: | Kelantan | | Area: | 11900 km2 | | Lat: | 5.76 | | Lon: | 102.15 | | Source: | RivDIS | | PointID: | 154 | | Area Units: | km2 | | Discharge Units: | m3/sec | | Starting Year: | 1949 | | Ending Year: | 1986 | | Total Years: | 38 | | Total Usable Years: | 35 | |
| |
| Year | Jan | Feb | Mar | Apr | May | Jun | Jul | Aug | Sep | Oct | Nov | Dec | Avg Annual |
|---|
| 1949 | 299.4 | 578 | -9999 | -9999 | -9999 | -9999 | 287.7 | 287.7 | 416.6 | 630.1 | 950.3 | 1392.9 | -9999 |
| 1950 | 829.3 | 913.9 | 472.6 | 420.5 | 630.1 | 472.6 | 407.5 | 371 | 553.3 | 661.3 | 729 | 809.8 | 605.91 |
| 1951 | 1787.4 | 697.8 | 372.3 | 325.5 | 332 | 311.1 | 296.8 | 279.9 | 561.1 | 753.7 | 1005 | 988.1 | 642.56 |
| 1952 | 1122.2 | 641.8 | 585.8 | 395.7 | 615.8 | 401 | 300.8 | 307.2 | 360.6 | 730.3 | 822.7 | 567.6 | 570.96 |
| 1953 | 762.9 | 536.3 | 483 | 367.1 | 614.4 | 505.1 | 429.6 | 265.6 | 442.6 | 609.2 | 788.9 | 903.4 | 559.01 |
| 1954 | 1472.3 | 496 | 339.8 | 334.6 | 403.6 | 445.2 | 436.1 | 497.3 | 492.1 | 774.6 | 641.8 | 1782.2 | 676.3 |
| 1955 | 1985.5 | 496 | 312.4 | 317.6 | 341.1 | 358 | 399.7 | 440 | 326.8 | 661.3 | 829.3 | 600.1 | 588.98 |
| 1956 | 437.4 | 428.3 | 356.7 | 480.4 | 426.9 | 509 | 395.7 | 430.9 | 765.5 | 1228.9 | 1491.9 | 1516.6 | 705.68 |
| 1957 | 1130 | 523.3 | 581.9 | 618.4 | 867 | 813.6 | 509 | 660 | 917.8 | 812.3 | 890.4 | 2151.9 | 872.97 |
| 1958 | 1027.1 | 758.9 | 486.9 | 243.4 | 394.4 | 387.9 | 171.8 | 471.3 | 341.1 | 632.7 | 863.1 | 449.1 | 518.98 |
| 1959 | 321.5 | 209.6 | 145.8 | 169.2 | 315 | 249.9 | 287.7 | 294.2 | 416.6 | 601.4 | 926.9 | 1012.8 | 412.55 |
| 1960 | 762.9 | 479.1 | 251.2 | 195.2 | 312.4 | 208.3 | 223.9 | 179.7 | 415.7 | 354.1 | 673.2 | 926.2 | 415.16 |
| 1961 | 1208.6 | 542.8 | 307.2 | 378.1 | 363.8 | 259.9 | 198.6 | 169.6 | 307.8 | 509.4 | 754.4 | 995.5 | 499.64 |
| 1962 | 1116.7 | 407.5 | 441.8 | 302.7 | 367.9 | 263.8 | 307 | -9999 | -9999 | 561.1 | 593.4 | 948.2 | -9999 |
| 1963 | 947.5 | 376.1 | 283.7 | 146.9 | 160.9 | 170.6 | 172.7 | 254.6 | 282.7 | 512.8 | 914.1 | 1073.2 | 441.32 |
| 1964 | 494.4 | 552.2 | 420.8 | 239.4 | 412 | 381.4 | 406 | 323 | 461 | 398.7 | 459.3 | 690.5 | 436.56 |
| 1965 | 324.3 | 253.6 | 165.2 | 234.2 | 333 | 247.9 | 273.1 | 350.3 | 520.1 | 748.6 | 856.4 | 1753.9 | 505.05 |
| 1966 | 1318.8 | 593 | 494.8 | 359.4 | 357.5 | 380.3 | -9999 | 417 | 439.1 | -9999 | -9999 | -9999 | -9999 |
| 1967 | -9999 | -9999 | 1236.6 | 527.4 | 577.4 | 349.3 | 404.7 | 344.9 | 343.9 | 461.4 | 1357 | -9999 | -9999 |
| 1968 | -9999 | 225.6 | 132.3 | 141.1 | 268 | 340.8 | 339.3 | 199.1 | 422.7 | 651.3 | 414.4 | 637.1 | -9999 |
| 1969 | 619.5 | 238.9 | 142.6 | 103.8 | 205.9 | 231.6 | 187.1 | 235.3 | 229.1 | 417.1 | 966.9 | 1577.7 | 429.63 |
| 1970 | 1088.5 | -9999 | -9999 | -9999 | 301.4 | 303.5 | 391.2 | 415.8 | 578 | 350 | 818.3 | 1152.8 | -9999 |
| 1971 | 2484.8 | 572.6 | 800.7 | 330.1 | 337.2 | -9999 | -9999 | -9999 | -9999 | 420.8 | 638.5 | 2909.6 | -9999 |
| 1972 | 410.5 | 356 | 189.2 | -9999 | -9999 | -9999 | -9999 | 250.7 | 625.5 | 519.4 | 798.5 | 2167.4 | -9999 |
| 1973 | 630 | 300 | 180 | 140 | 220 | 310 | 260 | 280 | 450 | 500 | 650 | 345 | 355.42 |
| 1974 | 570 | 410 | 250 | 420 | 480 | 290 | 391 | 295 | 442 | 540 | 756 | 715 | 463.25 |
| 1975 | 136 | 533 | 353 | 283 | 437 | 316 | 326 | 271 | 532 | 466 | 1276 | 1361 | 524.17 |
| 1976 | 592.6 | 302.9 | 231.4 | 248.1 | 395.7 | 407.9 | 328.6 | 440.9 | 457.2 | 675.3 | 1031.3 | 1139.2 | 520.92 |
| 1977 | 851.3 | 445.9 | 261.1 | 177.2 | 178.9 | 206.8 | 285.9 | -9999 | 266.4 | 715.5 | 908.3 | 665.3 | -9999 |
| 1978 | 699 | 297.6 | -9999 | -9999 | 314.2 | 327.8 | 390.1 | 245.2 | 472.2 | 484.6 | 759.1 | 1084.4 | -9999 |
| 1979 | 463 | 339.8 | 240.5 | 272.2 | 305.4 | 348.3 | 287.4 | 229.2 | 431.4 | 383.1 | 2078.7 | 912.8 | 524.32 |
| 1980 | 363.1 | 287.9 | 259.4 | 190.8 | 288.4 | 254.4 | 212.4 | 454.5 | 389.2 | 700 | 690.4 | 893.7 | 415.35 |
| 1981 | 410.8 | 263 | 157.4 | 254.7 | 402.3 | 213.6 | 226.5 | 130.2 | 285.8 | 446.2 | 547.2 | 646.5 | 332.02 |
| 1982 | -9999 | -9999 | 114.3 | 322.1 | -9999 | 442.8 | 302.3 | 311.5 | 409.4 | 543.7 | 631 | 1345.2 | -9999 |
| 1983 | 527.9 | 250.9 | 164.6 | 112.1 | 174.3 | 195.6 | 289.8 | 363.2 | -9999 | 391 | 475.3 | 2690.1 | -9999 |
| 1984 | 712.7 | 1508.4 | 779.8 | 554.9 | 661.1 | 541.8 | 473.1 | 393.8 | 488.4 | 594 | 452.4 | 1278.7 | 703.26 |
| 1985 | 739.4 | 696 | 670.4 | 644.1 | 617.7 | 591.4 | 565 | 538.2 | 511.9 | 485.4 | 459.1 | 432.8 | 579.28 |
| 1986 | 532.9 | 234.4 | 249.3 | 211.2 | 158 | 210.3 | 150.8 | 124.3 | 343.7 | 677.3 | 751.7 | 1321.3 | 413.77 |
| |
|
|
|
|
|
|
|
|
|
|
|
|
|
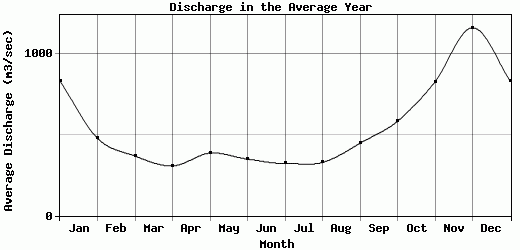
| Avg | 833.72 | 478.49 | 368.99 | 307.68 | 387.73 | 349.93 | 323.28 | 329.2 | 448.55 | 583.85 | 828.38 | 1162.16 | 527.42 |
| |
|
|
|
|
|
|
|
|
|
|
|
|
|
| Std Dev | 502.75 |
244.55 |
232.23 |
138.36 |
159.57 |
131.57 |
98.67 |
116.68 |
134.51 |
165.95 |
315.46 |
593.64 |
121.35 |
| |
|
|
|
|
|
|
|
|
|
|
|
|
|
| | Jan | Feb | Mar | Apr | May | Jun | Jul | Aug | Sep | Oct | Nov | Dec | Avg Annual |
Click here for this table in tab-delimited format.
Tab-delimited format will open in most table browsing software, i.e. Excel, etc.
View this station on the map.
Return to start.