Results
| Country: | U.S.S.R.
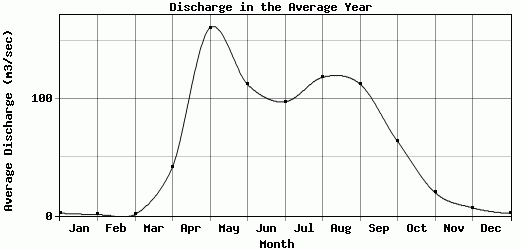
| | Station: | Maleta | | River: | Khilok | | Area: | 25700 km2 | | Lat: | 50.76 | | Lon: | 108.25 | | Source: | RivDIS | | PointID: | 155 | | Area Units: | km2 | | Discharge Units: | m3/sec | | Starting Year: | 1965 | | Ending Year: | 1984 | | Total Years: | 20 | | Total Usable Years: | 19 | |
| |
| Year | Jan | Feb | Mar | Apr | May | Jun | Jul | Aug | Sep | Oct | Nov | Dec | Avg Annual |
|---|
| 1965 | 3 | 2 | 2 | 39 | 126 | 51 | 60 | 70 | 81 | 50 | 18 | 6 | 42.33 |
| 1966 | 2 | 0 | 1 | 15 | 198 | 99 | 75 | 74 | 43 | 37 | 10 | 1 | 46.25 |
| 1967 | 0 | 0 | 0 | 66 | 72 | 42 | 125 | 137 | 166 | 106 | 32 | 12 | 63.17 |
| 1968 | 4 | 1 | 1 | 121 | 388 | 179 | 93 | 62 | 53 | 39 | 11 | 2 | 79.5 |
| 1969 | 0.5 | 0.2 | 0.2 | 18 | 60.5 | 33 | 63 | 381 | 439 | 136 | 44 | 22 | 99.78 |
| 1970 | 7.5 | 3.5 | 2.5 | 96 | 218 | 103 | 129 | 90 | 180 | 126 | 32.5 | 12 | 83.33 |
| 1971 | 2.4 | 0.7 | 0.6 | 103 | 150 | 142 | 96 | 258 | 83.5 | 58.5 | 18 | 5.1 | 76.48 |
| 1972 | 1.2 | 0.7 | 0.5 | 44 | 88 | 47 | 77 | 52.5 | 44.5 | 31 | 8.2 | 1.7 | 33.03 |
| 1973 | 0.6 | 0.2 | -9999 | 9.4 | 247 | 242 | 169 | 250 | 162 | 73 | 20.5 | 8.4 | -9999 |
| 1974 | 3 | 0.8 | 1.1 | 37 | 88 | 195 | 70 | 38 | 34 | 24 | 6.2 | 1.1 | 41.52 |
| 1975 | 0.5 | 0.3 | 0.5 | 31 | 211 | 116 | 77 | 60 | 77 | 52.5 | 16.5 | 2.5 | 53.73 |
| 1976 | 0.6 | 0.5 | 0.6 | 10.5 | 109 | 75 | 159 | 102 | 71.5 | 44.5 | 11 | 3.4 | 48.97 |
| 1977 | 0.4 | 0 | 0.2 | 64 | 161 | 109 | 42.5 | 31.5 | 32.5 | 21 | 6.5 | 2.6 | 39.27 |
| 1978 | 0.6 | 0.1 | 0.1 | 21 | 55 | 31 | 60.5 | 40 | 59 | 36 | 10.5 | 2.4 | 26.35 |
| 1979 | 0.4 | 0.2 | 0.2 | 5 | 135 | 38 | 26 | 23.5 | 26 | 19.5 | 9 | 1.5 | 23.69 |
| 1980 | 0.17 | 0.12 | 0.11 | 2.5 | 198 | 80 | 73.5 | 65.5 | 41.5 | 29 | 8 | 3.5 | 41.83 |
| 1981 | 1.3 | 0.96 | 0.54 | 60 | 115 | 53.5 | 35.5 | 42 | 40 | 24 | 9.2 | 2.7 | 32.06 |
| 1982 | 0.53 | 0.07 | 0.1 | 50.5 | 75 | 88 | 189 | 170 | 225 | 110 | 34 | 14 | 79.68 |
| 1983 | 8.3 | 4.7 | 3.6 | 13 | 164 | 212 | 169 | 287 | 190 | 126 | 52.5 | 14 | 103.68 |
| 1984 | 5.1 | 2.8 | 3 | 32.5 | 372 | 322 | 169 | 146 | 215 | 135 | 39 | 18 | 121.62 |
| |
|
|
|
|
|
|
|
|
|
|
|
|
|
| Avg | 2.11 | 0.94 | 0.94 | 41.92 | 161.53 | 112.88 | 97.9 | 119 | 113.18 | 63.9 | 19.83 | 6.8 | 59.8 |
| |
|
|
|
|
|
|
|
|
|
|
|
|
|
| Std Dev | 2.36 |
1.27 |
1.03 |
33.28 |
91.13 |
77.8 |
48.93 |
98 |
99.15 |
41.29 |
13.7 |
6.16 |
27.72 |
| |
|
|
|
|
|
|
|
|
|
|
|
|
|
| | Jan | Feb | Mar | Apr | May | Jun | Jul | Aug | Sep | Oct | Nov | Dec | Avg Annual |
Click here for this table in tab-delimited format.
Tab-delimited format will open in most table browsing software, i.e. Excel, etc.
View this station on the map.
Return to start.