Results
| Country: | U.S.A.
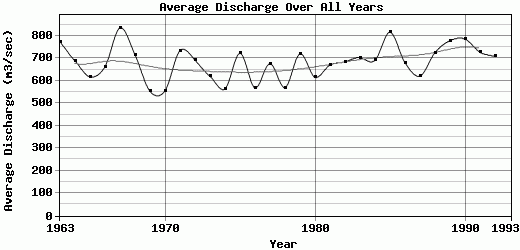
| | Station: | AMBLER AK | | River: | KOBUK R | | Area: | 17015.29 | | Lat: | 67.09 | | Lon: | -157.84 | | Source: | USGS | | PointID: | 15744000 | | Area Units: | km2 | | Discharge Units: | m3/sec | | Starting Year: | 1963 | | Ending Year: | 1993 | | Total Years: | 31 | | Total Usable Years: | 30 | |
| |
| Year | Jan | Feb | Mar | Apr | May | Jun | Jul | Aug | Sep | Oct | Nov | Dec | Avg Annual |
|---|
| 1963 | 184.06 | 198.22 | 198.22 | 254.85 | 1761.59 | 1239.06 | 1769.9 | 1811.83 | 995.44 | 547.07 | 176.98 | 152.91 | 774.18 |
| 1964 | 175.57 | 169.9 | 164.24 | 184.06 | 453.99 | 2216.28 | 1731.54 | 1393.56 | 880.85 | 490.61 | 223.14 | 175.57 | 688.28 |
| 1965 | 189.72 | 175.57 | 158.58 | 175.57 | 511.17 | 1061.6 | 1658.65 | 1573.97 | 1041.5 | 466.5 | 206.05 | 192.56 | 617.62 |
| 1966 | 186.89 | 181.23 | 172.64 | 175.57 | 1158.71 | 1941.89 | 1505.09 | 1191.69 | 685.74 | 354.24 | 226.54 | 163.87 | 662.01 |
| 1967 | 141.58 | 141.58 | 141.58 | 176.41 | 1056.04 | 1666.27 | 1911.31 | 2780.91 | 1127.96 | 470.7 | 215.68 | 195.48 | 835.46 |
| 1968 | 189.63 | 185.53 | 181.69 | 192.74 | 1028.55 | 1701.57 | 1795.57 | 1573.88 | 871.13 | 464.95 | 237.39 | 165.79 | 715.7 |
| 1969 | 155.74 | 149.17 | 153.92 | 221.34 | 757.98 | 1053.01 | 1423.16 | 1194.16 | 674.89 | 388.49 | 251.83 | 212.47 | 553.01 |
| 1970 | 203.88 | 203.88 | 209.36 | 239 | 550.81 | 842.53 | 1467.92 | 1248.6 | 781.36 | 422.29 | 274.86 | 217.22 | 555.14 |
| 1971 | 184.33 | 175.57 | 169.9 | 251.64 | 1349.81 | 1458.23 | 1611.88 | 1850.56 | 892.93 | 455.81 | 215.96 | 188.72 | 733.78 |
| 1972 | 186.89 | 186.89 | 186.89 | 191.61 | 1232.98 | 1514.77 | 1650.24 | 1524.55 | 893.68 | 373.42 | 193.88 | 162.41 | 691.52 |
| 1973 | 152.91 | 152.91 | 158.76 | 241.07 | 803.56 | 1320.04 | 1601.74 | 1389.45 | 766.26 | 403.47 | 255.61 | 189.27 | 619.59 |
| 1974 | 144.33 | 125.2 | 115.28 | 166.22 | 676.23 | 908.69 | 1384.7 | 1427.54 | 961.65 | 422.2 | 240.69 | 195.48 | 564.02 |
| 1975 | 178.4 | 169.9 | 158.58 | 176.89 | 1000.23 | 1336.85 | 1896.51 | 1582.1 | 1046.31 | 569.08 | 318.85 | 231.83 | 722.13 |
| 1976 | 198.77 | 181.23 | 175.57 | 234.28 | 737.16 | 1097.76 | 1412.47 | 1563.28 | 614.67 | 323.27 | 156.22 | 128.34 | 568.58 |
| 1977 | 132.91 | 193.67 | 177.67 | 272.79 | 835.81 | 1576.41 | 1476.5 | 1701.03 | 890.76 | 415.8 | 235.03 | 204.16 | 676.05 |
| 1978 | 184.06 | 184.06 | 184.06 | 270.9 | 686.18 | 842.62 | 1382.14 | 1526.19 | 764.46 | 347.2 | 245.79 | 223.25 | 570.08 |
| 1979 | 201.23 | 198.22 | 198.22 | 263.54 | 1007.72 | 1157.22 | 1799.96 | 1872.94 | 968.35 | 490.34 | 266.37 | 206.99 | 719.26 |
| 1980 | 181.23 | 205.84 | 211.56 | 294.21 | 550.81 | 1041.88 | 1667.6 | 1431.01 | 794.01 | 512.99 | 274.67 | 221.88 | 615.64 |
| 1981 | 196.76 | 195.39 | 204.89 | 241.64 | 670.2 | 1085.96 | 1872.85 | 1838.6 | 809.68 | 430.14 | 274.86 | 217.22 | 669.85 |
| 1982 | 196.57 | 185.07 | 181.23 | 212.57 | 1022.24 | 1562.15 | 1691.16 | 1344.42 | 910.01 | 422.56 | 262.22 | 221.42 | 684.3 |
| 1983 | 203.52 | 194.58 | 189.63 | 226.35 | 645.17 | 927.76 | 1810.19 | 1849.01 | 1092.66 | 674.77 | 370.01 | 242.43 | 702.17 |
| 1984 | 183.24 | 177.32 | 203.52 | 235.03 | 685.91 | 1379.23 | 1916.79 | 1727.61 | 816.66 | 479.84 | 266.65 | 219.23 | 690.92 |
| 1985 | 188.08 | 175.57 | 192.92 | 209.55 | 970.18 | 1702.61 | 2023.84 | 1626.22 | 1297.39 | 700.25 | 398.33 | 305.09 | 815.84 |
| 1986 | 256.68 | 231.39 | 212.29 | 213.89 | 843.21 | 1190.45 | 1913.86 | 1343.14 | 862.72 | 539.85 | 303.94 | 248.46 | 679.99 |
| 1987 | 227.81 | 203.88 | 192.56 | 218.98 | 553.55 | 1038.86 | 1718.66 | 1491.58 | 860.74 | 458.55 | 269.2 | 214.11 | 620.71 |
| 1988 | 197.85 | 190.02 | 186.89 | 267.12 | 733.96 | 1567.06 | 2173.83 | 1699.75 | 848.09 | 395.89 | 227.29 | 215.21 | 725.25 |
| 1989 | 206.81 | 165.25 | 172.83 | 399.08 | 1094.13 | 1457.85 | 1920.26 | 1762.41 | 1056.79 | 531.26 | 317.72 | 256.49 | 778.41 |
| 1990 | 216.85 | 206.51 | 199.5 | 319.23 | 949.62 | 1480.88 | 1639.01 | 1597.9 | 1633.7 | 647.55 | 311.11 | 226.17 | 785.67 |
| 1991 | 215.85 | 212.38 | 214.66 | 304.41 | 1558.53 | 1379.23 | 1619.28 | 1347.52 | 841.96 | 463.85 | 302.52 | 258.87 | 726.59 |
| 1992 | 226.35 | 206.62 | 201.42 | 216.25 | 779.45 | 1850.04 | 1952.96 | 1535.88 | 684.52 | 390.68 | 252.78 | 219.05 | 709.67 |
| 1993 | -9999 | -9999 | -9999 | -9999 | -9999 | -9999 | -9999 | -9999 | -9999 | -9999 | -9999 | -9999 | -9999 |
| |
|
|
|
|
|
|
|
|
|
|
|
|
|
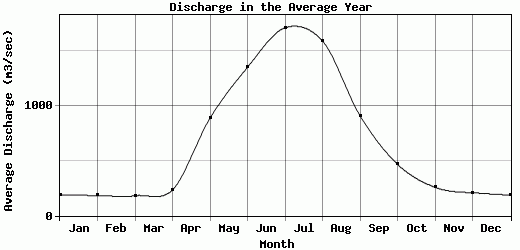
| Avg | 189.62 | 184.09 | 182.3 | 234.89 | 888.85 | 1353.29 | 1713.32 | 1593.38 | 912.23 | 468.45 | 259.07 | 209.06 | 682.38 |
| |
|
|
|
|
|
|
|
|
|
|
|
|
|
| Std Dev | 26.09 |
22.05 |
22.62 |
50 |
302.97 |
335.24 |
201.2 |
293.43 |
197.99 |
90.83 |
51.46 |
34.98 |
75.47 |
| |
|
|
|
|
|
|
|
|
|
|
|
|
|
| | Jan | Feb | Mar | Apr | May | Jun | Jul | Aug | Sep | Oct | Nov | Dec | Avg Annual |
Click here for this table in tab-delimited format.
Tab-delimited format will open in most table browsing software, i.e. Excel, etc.
View this station on the map.
Return to start.