Results
| Country: | U.S.S.R.
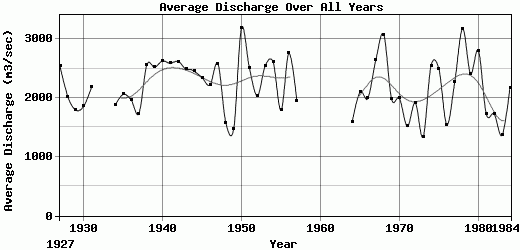
| | Station: | Srednekolymsk | | River: | Kolyma | | Area: | 361000 km2 | | Lat: | 67.37 | | Lon: | 153.67 | | Source: | RivDIS | | PointID: | 937 | | Area Units: | km2 | | Discharge Units: | m3/sec | | Starting Year: | 1927 | | Ending Year: | 1984 | | Total Years: | 58 | | Total Usable Years: | 50 | |
| |
| Year | Jan | Feb | Mar | Apr | May | Jun | Jul | Aug | Sep | Oct | Nov | Dec | Avg Annual |
|---|
| 1927 | 125 | 85.5 | 70 | 61 | 440 | 11400 | 6750 | 5180 | 4690 | 1090 | 342 | 223 | 2538.04 |
| 1928 | 97 | 60.5 | 48.5 | 48.5 | 3480 | 10200 | 4840 | 2910 | 1690 | 506 | 195 | 138 | 2017.79 |
| 1929 | 82.5 | 61.5 | 58.5 | 55 | 656 | 9920 | 3070 | 3580 | 2890 | 769 | 241 | 157 | 1795.04 |
| 1930 | 91.5 | 63.5 | 51 | 44.5 | 86.5 | 7740 | 5500 | 3920 | 3560 | 795 | 249 | 162 | 1855.25 |
| 1931 | 107 | 73.5 | 60 | 52.5 | 143 | 9580 | 4090 | 4930 | 5730 | 935 | 293 | 191 | 2182.08 |
| 1932 | -9999 | -9999 | -9999 | -9999 | -9999 | -9999 | -9999 | -9999 | -9999 | -9999 | -9999 | -9999 | -9999 |
| 1933 | -9999 | -9999 | -9999 | -9999 | -9999 | -9999 | -9999 | -9999 | -9999 | -9999 | -9999 | -9999 | -9999 |
| 1934 | 90 | 56 | 45 | 45 | 2990 | 8620 | 3500 | 2890 | 2750 | 1020 | 393 | 132 | 1877.58 |
| 1935 | 118 | 111 | 106 | 96 | 4210 | 9340 | 3730 | 2920 | 2770 | 826 | 280 | 216 | 2060.25 |
| 1936 | 98.5 | 59 | 49 | 42 | 1120 | 11900 | 2800 | 3100 | 3080 | 774 | 353 | 235 | 1967.54 |
| 1937 | 90.5 | 57 | 49 | 43.5 | 473 | 7270 | 6210 | 3140 | 2300 | 700 | 302 | 170 | 1733.75 |
| 1938 | 119 | 87 | 66.5 | 57 | 66 | 16100 | 6420 | 4260 | 2610 | 546 | 241 | 138 | 2559.21 |
| 1939 | 82.5 | 59.5 | 48.5 | 43.5 | 4330 | 3930 | 6140 | 6820 | 6370 | 1770 | 457 | 203 | 2521.17 |
| 1940 | 114 | 83 | 71 | 52.5 | 2900 | 12600 | 5530 | 3990 | 5080 | 727 | 220 | 176 | 2628.63 |
| 1941 | 102 | 62 | 57.5 | 52.5 | 222 | 12100 | 7390 | 4050 | 4320 | 2100 | 357 | 251 | 2588.67 |
| 1942 | 122 | 79 | 59 | 46.5 | 64.5 | 15200 | 5420 | 5630 | 3510 | 797 | 287 | 200 | 2617.92 |
| 1943 | 160 | 101 | 77 | 71.5 | 4470 | 8890 | 4120 | 4080 | 4500 | 2570 | 517 | 297 | 2487.79 |
| 1944 | 165 | 93.5 | 75 | 64.5 | 5950 | 6100 | 4350 | 4470 | 4380 | 2930 | 483 | 378 | 2453.25 |
| 1945 | 176 | 95.5 | 67 | 58 | 5520 | 8060 | 6070 | 3790 | 2880 | 1010 | 249 | 164 | 2344.96 |
| 1946 | 108 | 64.5 | 58.5 | 51 | 2640 | 8380 | 5980 | 3570 | 3860 | 1340 | 351 | 192 | 2216.25 |
| 1947 | 114 | 76 | 58.5 | 52 | 71 | 13100 | 9270 | 4540 | 2440 | 823 | 263 | 175 | 2581.88 |
| 1948 | 130 | 83.5 | 57 | 50.5 | 4060 | 5050 | 3030 | 3890 | 1930 | 366 | 183 | 142 | 1581 |
| 1949 | 83 | 60 | 54.5 | 57 | 1710 | 7620 | 2740 | 2700 | 1950 | 332 | 177 | 132 | 1467.96 |
| 1950 | 84 | 58 | 44 | 34.5 | 112 | 13500 | 9230 | 9890 | 4340 | 494 | 263 | 223 | 3189.38 |
| 1951 | 124 | 87 | 70.5 | 60 | 2650 | 16000 | 5020 | 3320 | 1540 | 675 | 279 | 186 | 2500.96 |
| 1952 | 100 | 70 | 58 | 52.5 | 736 | 10800 | 6210 | 3110 | 2360 | 475 | 262 | 178 | 2034.29 |
| 1953 | 101 | 69 | 57.5 | 48 | 5570 | 8670 | 5440 | 4960 | 3960 | 931 | 433 | 292 | 2544.29 |
| 1954 | 129 | 80.5 | 58 | 52.5 | 442 | 14200 | 6580 | 3170 | 4870 | 1100 | 368 | 228 | 2606.5 |
| 1955 | 110 | 67.5 | 63 | 49 | 1900 | 8080 | 5230 | 3420 | 1770 | 345 | 233 | 197 | 1788.71 |
| 1956 | 135 | 104 | 77 | 70 | 2890 | 17300 | 6450 | 2580 | 2610 | 434 | 261 | 186 | 2758.08 |
| 1957 | 106 | 74 | 65.5 | 58 | 1850 | 9900 | 4000 | 4560 | 1580 | 740 | 291 | 188 | 1951.04 |
| 1958 | -9999 | -9999 | -9999 | -9999 | -9999 | -9999 | -9999 | -9999 | -9999 | -9999 | -9999 | -9999 | -9999 |
| 1959 | -9999 | -9999 | -9999 | -9999 | -9999 | -9999 | -9999 | -9999 | -9999 | -9999 | -9999 | -9999 | -9999 |
| 1960 | -9999 | -9999 | -9999 | -9999 | -9999 | -9999 | -9999 | -9999 | -9999 | -9999 | -9999 | -9999 | -9999 |
| 1961 | -9999 | -9999 | -9999 | -9999 | -9999 | -9999 | -9999 | -9999 | -9999 | -9999 | -9999 | -9999 | -9999 |
| 1962 | -9999 | -9999 | -9999 | -9999 | -9999 | -9999 | -9999 | -9999 | -9999 | -9999 | -9999 | -9999 | -9999 |
| 1963 | -9999 | -9999 | -9999 | -9999 | -9999 | -9999 | -9999 | -9999 | -9999 | -9999 | -9999 | -9999 | -9999 |
| 1964 | 116 | 67 | 51 | 49 | 1690 | 6400 | 3400 | 3810 | 2470 | 582 | 204 | 175 | 1584.5 |
| 1965 | 128 | 97 | 67 | 52 | 253 | 14400 | 4520 | 2030 | 2510 | 689 | 310 | 150 | 2100.5 |
| 1966 | 180 | 127 | 104 | 90 | 2020 | 9250 | 3140 | 2460 | 5140 | 733 | 384 | 304 | 1994.33 |
| 1967 | 124 | 86 | 76 | 66 | 7830 | 9240 | 4780 | 4720 | 3210 | 1010 | 330 | 177 | 2637.42 |
| 1968 | 94 | 67 | 60 | 53 | 5150 | 12400 | 7480 | 7050 | 2720 | 1200 | 469 | 201 | 3078.67 |
| 1969 | 108 | 104 | 90 | 67 | 250 | 11800 | 5420 | 2840 | 1900 | 839 | 209 | 134 | 1980.08 |
| 1970 | 97.5 | 16 | 58.5 | 57.5 | 3420 | 7560 | 3270 | 3650 | 3390 | 1750 | 462 | 156 | 1990.63 |
| 1971 | 109 | 68.5 | 61.5 | 53.5 | 4060 | 6100 | 3470 | 2380 | 1100 | 515 | 165 | 127 | 1517.46 |
| 1972 | 101 | 71 | 60.5 | 59 | 3020 | 6260 | 3590 | 3300 | 5240 | 826 | 305 | 173 | 1917.13 |
| 1973 | 99 | 49.5 | 33 | 31.5 | 1930 | 5760 | 1700 | 1600 | 1980 | 1950 | 646 | 261 | 1336.67 |
| 1974 | 147 | 89.5 | 73 | 63.5 | 1690 | 9980 | 3930 | 2660 | 4810 | 1660 | 5230 | 214 | 2545.58 |
| 1975 | 86.5 | 64 | 56 | 51.5 | 2340 | 9280 | 4650 | 3070 | 8220 | 1450 | 377 | 194 | 2486.58 |
| 1976 | 143 | 96.5 | 70 | 60 | 103 | 10300 | 3830 | 1800 | 1280 | 470 | 222 | 166 | 1545.04 |
| 1977 | 100 | 76.5 | 56 | 46 | 1670 | 7950 | 2970 | 6190 | 5690 | 1560 | 610 | 274 | 2266.04 |
| 1978 | 157 | 116 | 86.5 | 75 | 732 | 16200 | 11400 | 5610 | 2440 | 744 | 304 | 204 | 3172.38 |
| 1979 | 124 | 82.5 | 68 | 60.5 | 3690 | 8470 | 6360 | 4970 | 3070 | 1310 | 473 | 255 | 2411.08 |
| 1980 | 155 | 123 | 105 | 79 | 383 | 16000 | 9450 | 3550 | 1990 | 1100 | 473 | 228 | 2803 |
| 1981 | 138 | 120 | 80.5 | 95.5 | 3990 | 5710 | 2600 | 3650 | 2260 | 1360 | 460 | 238 | 1725.17 |
| 1982 | 138 | 120 | 80.5 | 95.5 | 3990 | 5710 | 2600 | 3650 | 2260 | 1360 | 460 | 238 | 1725.17 |
| 1983 | 248 | 97.5 | 67.5 | 61 | 1600 | 5720 | 2150 | 3220 | 2040 | 665 | 297 | 192 | 1363.17 |
| 1984 | 149 | 171 | 160 | 72.5 | 3390 | 4760 | 6080 | 6130 | 3260 | 1180 | 414 | 301 | 2172.29 |
| |
|
|
|
|
|
|
|
|
|
|
|
|
|
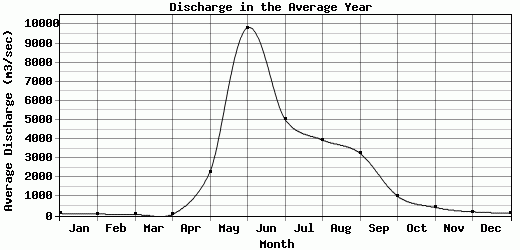
| Avg | 120.13 | 81.83 | 66.9 | 58.15 | 2299.06 | 9816 | 5038 | 3954.2 | 3266 | 1017.46 | 432.54 | 202.24 | 2196.04 |
| |
|
|
|
|
|
|
|
|
|
|
|
|
|
| Std Dev | 30.74 |
25.11 |
20.04 |
14.24 |
1884.13 |
3402.71 |
2020.96 |
1474.44 |
1466.72 |
551.98 |
694.17 |
52.5 |
461.33 |
| |
|
|
|
|
|
|
|
|
|
|
|
|
|
| | Jan | Feb | Mar | Apr | May | Jun | Jul | Aug | Sep | Oct | Nov | Dec | Avg Annual |
Click here for this table in tab-delimited format.
Tab-delimited format will open in most table browsing software, i.e. Excel, etc.
View this station on the map.
Return to start.