Results
| Country: | Canada
| | Station: | Copeland | | River: | Kootenai | | Area: | 34700 km2 | | Lat: | 48.91 | | Lon: | -116.41 | | Source: | RivDIS | | PointID: | 278 | | Area Units: | km2 | | Discharge Units: | m3/sec | | Starting Year: | 1929 | | Ending Year: | 1984 | | Total Years: | 56 | | Total Usable Years: | 55 | |
| |
| Year | Jan | Feb | Mar | Apr | May | Jun | Jul | Aug | Sep | Oct | Nov | Dec | Avg Annual |
|---|
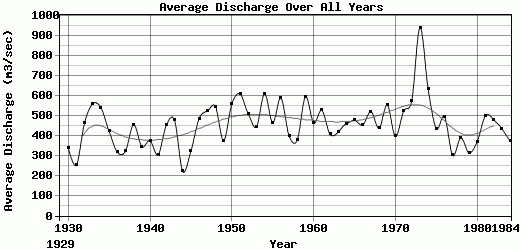
| 1929 | -9999 | -9999 | -9999 | -9999 | 812 | 1240 | 453 | 229 | 147 | 124 | 93.1 | 96.7 | -9999 |
| 1930 | 82 | 107 | 119 | 525 | 760 | 1140 | 582 | 258 | 170 | 138 | 113 | 85.9 | 339.99 |
| 1931 | 87.7 | 91 | 113 | 199 | 796 | 741 | 356 | 184 | 150 | 115 | 103 | 86.2 | 251.82 |
| 1932 | 79.4 | 126 | 214 | 533 | 1390 | 1620 | 603 | 286 | 192 | 150 | 189 | 177 | 463.28 |
| 1933 | 132 | 98.8 | 131 | 447 | 1230 | 2000 | 964 | 361 | 258 | 287 | 361 | 438 | 558.98 |
| 1934 | 385 | 280 | 346 | 1310 | 1680 | 1090 | 464 | 237 | 161 | 141 | 258 | 139 | 540.92 |
| 1935 | 162 | 194 | 167 | 336 | 1150 | 1410 | 786 | 331 | 186 | 137 | 112 | 93.3 | 422.03 |
| 1936 | 86.8 | 61.2 | 118 | 591 | 1210 | 829 | 325 | 187 | 139 | 105 | 81.1 | 87.7 | 318.4 |
| 1937 | 58.6 | 71.5 | 83.8 | 223 | 930 | 1090 | 507 | 237 | 155 | 146 | 216 | 145 | 321.91 |
| 1938 | 156 | 114 | 173 | 653 | 1380 | 1610 | 625 | 230 | 167 | 149 | 118 | 97.5 | 456.04 |
| 1939 | 116 | 84.1 | 146 | 474 | 1060 | 832 | 574 | 224 | 156 | 168 | 164 | 144 | 345.18 |
| 1940 | 930 | 104 | 168 | 425 | 1030 | 781 | 316 | 186 | 173 | 160 | 124 | 107 | 375.33 |
| 1941 | 94.4 | 87 | 144 | 360 | 688 | 629 | 306 | 181 | 261 | 293 | 230 | 386 | 304.95 |
| 1942 | 152 | 126 | 127 | 487 | 1140 | 1360 | 966 | 377 | 221 | 175 | 161 | 133 | 452.08 |
| 1943 | 101 | 118 | 143 | 1050 | 1030 | 1330 | 1040 | 352 | 180 | 155 | 128 | 98.6 | 477.13 |
| 1944 | 88.9 | 83.3 | 83.2 | 169 | 584 | 700 | 285 | 190 | 150 | 142 | 112 | 79.3 | 222.23 |
| 1945 | 89.8 | 92.1 | 95.5 | 152 | 891 | 1130 | 574 | 222 | 177 | 155 | 162 | 124 | 322.03 |
| 1946 | 114 | 97.2 | 166 | 596 | 1570 | 1500 | 732 | 296 | 245 | 192 | 144 | 164 | 484.68 |
| 1947 | 133 | 180 | 259 | 661 | 1670 | 1250 | 600 | 279 | 226 | 495 | 333 | 195 | 523.42 |
| 1948 | 152 | 136 | 151 | 531 | 1690 | 2150 | 715 | 400 | 216 | 171 | 138 | 98.4 | 545.7 |
| 1949 | 97.8 | 110 | 146 | 587 | 1450 | 857 | 361 | 225 | 161 | 148 | 185 | 167 | 374.57 |
| 1950 | 110 | 133 | 221 | 460 | 1240 | 2000 | 1100 | 364 | 197 | 268 | 289 | 320 | 558.5 |
| 1951 | 230 | 386 | 206 | 624 | 1830 | 1350 | 1120 | 400 | 322 | 398 | 244 | 200 | 609.17 |
| 1952 | 165 | 162 | 148 | 783 | 1360 | 1140 | 677 | 304 | 196 | 146 | 110 | 940 | 510.92 |
| 1953 | 162 | 196 | 142 | 321 | 1100 | 1590 | 853 | 327 | 194 | 155 | 148 | 125 | 442.75 |
| 1954 | 93.4 | 131 | 162 | 409 | 1730 | 1880 | 1470 | 503 | 330 | 218 | 214 | 165 | 608.78 |
| 1955 | 120 | 107 | 104 | 217 | 861 | 1830 | 1010 | 356 | 198 | 264 | 294 | 223 | 465.33 |
| 1956 | 205 | 136 | 201 | 837 | 1870 | 1960 | 861 | 340 | 199 | 187 | 141 | 125 | 588.5 |
| 1957 | 82.5 | 98.4 | 174 | 340 | 1770 | 1130 | 441 | 233 | 155 | 148 | 126 | 103 | 400.08 |
| 1958 | 96.2 | 120 | 155 | 344 | 1470 | 964 | 473 | 223 | 177 | 173 | 175 | 164 | 377.85 |
| 1959 | 185 | 127 | 144 | 562 | 1310 | 1970 | 951 | 361 | 489 | 419 | 343 | 274 | 594.58 |
| 1960 | 160 | 174 | 278 | 746 | 1020 | 1480 | 758 | 313 | 201 | 160 | 162 | 115 | 463.92 |
| 1961 | 124 | 211 | 204 | 402 | 1640 | 2170 | 566 | 293 | 210 | 217 | 158 | 126 | 526.75 |
| 1962 | 118 | 150 | 121 | 583 | 1020 | 1280 | 567 | 299 | 187 | 177 | 197 | 190 | 407.42 |
| 1963 | 124 | 213 | 181 | 366 | 1010 | 1340 | 811 | 319 | 202 | 159 | 162 | 132 | 418.25 |
| 1964 | 124 | 105 | 93.7 | 290 | 1120 | 1880 | 782 | 329 | 222 | 244 | 185 | 143 | 459.81 |
| 1965 | 136 | 154 | 180 | 580 | 1198 | 1640 | 730 | 345 | 233 | 204 | 182 | 138 | 476.67 |
| 1966 | 125 | 121 | 160 | 546 | 1300 | 1550 | 754 | 287 | 172 | 143 | 140 | 144 | 453.5 |
| 1967 | 146 | 176 | 165 | 269 | 1180 | 2370 | 962 | 336 | 185 | 162 | 164 | 134 | 520.75 |
| 1968 | 127 | 173 | 231 | 241 | 1020 | 1450 | 743 | 326 | 256 | 247 | 242 | 192 | 437.33 |
| 1969 | 144 | 135 | 177 | 848 | 1750 | 1710 | 902 | 309 | 200 | 197 | 147 | 118 | 553.08 |
| 1970 | 950 | 122 | 121 | 195 | 989 | 1170 | 436 | 214 | 163 | 152 | 130 | 112 | 396.17 |
| 1971 | 137 | 269 | 147 | 481 | 1720 | 1710 | 852 | 357 | 202 | 162 | 144 | 85.2 | 522.18 |
| 1972 | 73.9 | 131 | 413 | 374 | 1110 | 1310 | 725 | 425 | 583 | 912 | 716 | 138 | 575.91 |
| 1973 | 123 | 119 | 137 | 197 | 382 | 271 | 193 | 292 | 572 | 300 | 4980 | 3710 | 939.67 |
| 1974 | 535 | 620 | 453 | 682 | 1011 | 1167 | 665 | 419 | 343 | 691 | 580 | 413 | 631.58 |
| 1975 | 455 | 673 | 377 | 252 | 737 | 588 | 195 | 115 | 238 | 339 | 534 | 725 | 435.67 |
| 1976 | 814 | 554 | 431 | 456 | 640 | 341 | 478 | 557 | 332 | 461 | 456 | 433 | 496.08 |
| 1977 | 384 | 331 | 313 | 337 | 296 | 176 | 312 | 223 | 197 | 306 | 486 | 263 | 302 |
| 1978 | 305 | 283 | 197 | 296 | 538 | 461 | 423 | 301 | 327 | 375 | 576 | 589 | 389.25 |
| 1979 | 561 | 181 | 171 | 203 | 466 | 232 | 138 | 176 | 224 | 363 | 568 | 489 | 314.33 |
| 1980 | 340 | 237 | 149 | 348 | 477 | 551 | 328 | 247 | 231 | 418 | 494 | 630 | 370.83 |
| 1981 | 650 | 601 | 294 | 263 | 524 | 704 | 852 | 434 | 276 | 394 | 421 | 586 | 499.92 |
| 1982 | 576 | 556 | 397 | 408 | 861 | 551 | 362 | 315 | 266 | 396 | 573 | 510 | 480.92 |
| 1983 | 616 | 535 | 357 | 338 | 577 | 369 | 411 | 324 | 305 | 379 | 397 | 616 | 435.33 |
| 1984 | 588 | 279 | 181 | 260 | 360 | 408 | 344 | 366 | 279 | 360 | 465 | 605 | 374.58 |
| |
|
|
|
|
|
|
|
|
|
|
|
|
|
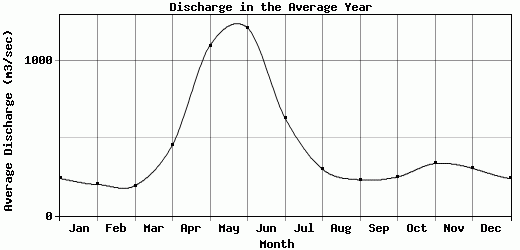
| Avg | 239.7 | 201.1 | 194.17 | 457.58 | 1100.5 | 1213.96 | 631.77 | 300.07 | 231.32 | 250.71 | 336.93 | 305.68 | 457.07 |
| |
|
|
|
|
|
|
|
|
|
|
|
|
|
| Std Dev | 223.51 |
151.82 |
91.3 |
225.23 |
415.76 |
551.85 |
273.62 |
84 |
91.88 |
148.29 |
645.67 |
499.28 |
115.19 |
| |
|
|
|
|
|
|
|
|
|
|
|
|
|
| | Jan | Feb | Mar | Apr | May | Jun | Jul | Aug | Sep | Oct | Nov | Dec | Avg Annual |
Click here for this table in tab-delimited format.
Tab-delimited format will open in most table browsing software, i.e. Excel, etc.
View this station on the map.
Return to start.