Results
| Country: | U.S.S.R.
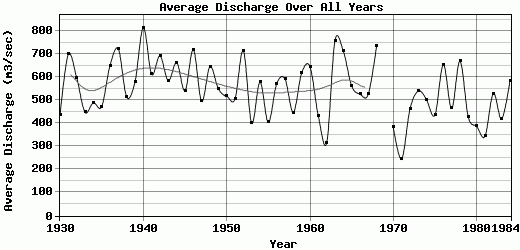
| | Station: | Surra | | River: | Kura | | Area: | 178000 km2 | | Lat: | 40.12 | | Lon: | 48.67 | | Source: | RivDIS | | PointID: | 818 | | Area Units: | km2 | | Discharge Units: | m3/sec | | Starting Year: | 1930 | | Ending Year: | 1984 | | Total Years: | 55 | | Total Usable Years: | 54 | |
| |
| Year | Jan | Feb | Mar | Apr | May | Jun | Jul | Aug | Sep | Oct | Nov | Dec | Avg Annual |
|---|
| 1930 | 320 | 336 | 428 | 685 | 707 | 845 | 472 | 185 | 204 | 358 | 319 | 363 | 435.17 |
| 1931 | 343 | 343 | 553 | 961 | 1530 | 1930 | 1060 | 472 | 321 | 283 | 283 | 317 | 699.67 |
| 1932 | 270 | 374 | 862 | 1200 | 1700 | 1030 | 344 | 216 | 292 | 352 | 284 | 253 | 598.08 |
| 1933 | 206 | 267 | 409 | 560 | 1120 | 829 | 359 | 214 | 241 | 374 | 384 | 421 | 448.67 |
| 1934 | 318 | 327 | 468 | 800 | 1320 | 894 | 410 | 321 | 237 | 257 | 265 | 255 | 489.33 |
| 1935 | 385 | 416 | 475 | 961 | 1070 | 734 | 465 | 159 | 153 | 198 | 312 | 346 | 472.83 |
| 1936 | 247 | 281 | 319 | 743 | 1310 | 1890 | 680 | 452 | 350 | 462 | 549 | 517 | 650 |
| 1937 | 348 | 453 | 593 | 1070 | 1640 | 1890 | 891 | 417 | 362 | 308 | 351 | 343 | 722.17 |
| 1938 | 331 | 352 | 416 | 946 | 1600 | 914 | 335 | 210 | 192 | 323 | 259 | 293 | 514.25 |
| 1939 | 270 | 294 | 338 | 762 | 1310 | 679 | 608 | 478 | 515 | 565 | 644 | 487 | 579.17 |
| 1940 | 446 | 526 | 653 | 1800 | 2250 | 1340 | 971 | 287 | 212 | 398 | 493 | 393 | 814.08 |
| 1941 | 436 | 538 | 803 | 1390 | 1820 | 788 | 277 | 180 | 179 | 271 | 359 | 308 | 612.42 |
| 1942 | 328 | 373 | 531 | 1060 | 2120 | 1440 | 498 | 269 | 275 | 377 | 573 | 465 | 692.42 |
| 1943 | 375 | 373 | 422 | 1140 | 1440 | 925 | 426 | 252 | 390 | 405 | 468 | 391 | 583.92 |
| 1944 | 368 | 397 | 594 | 913 | 1780 | 1140 | 699 | 402 | 366 | 428 | 524 | 354 | 663.75 |
| 1945 | 371 | 385 | 427 | 932 | 1280 | 1230 | 469 | 243 | 233 | 267 | 310 | 344 | 540.92 |
| 1946 | 368 | 409 | 536 | 1130 | 1900 | 1670 | 669 | 340 | 242 | 510 | 475 | 380 | 719.08 |
| 1947 | 434 | 425 | 600 | 758 | 820 | 828 | 378 | 207 | 266 | 355 | 498 | 376 | 495.42 |
| 1948 | 367 | 371 | 374 | 1060 | 1700 | 1650 | 448 | 181 | 391 | 438 | 382 | 401 | 646.92 |
| 1949 | 362 | 379 | 484 | 994 | 1510 | 953 | 287 | 210 | 320 | 460 | 317 | 326 | 550.17 |
| 1950 | 294 | 320 | 674 | 1040 | 1310 | 932 | 347 | 148 | 169 | 331 | 328 | 319 | 517.67 |
| 1951 | 333 | 364 | 487 | 603 | 766 | 613 | 318 | 120 | 225 | 903 | 790 | 541 | 505.25 |
| 1952 | 420 | 408 | 543 | 1600 | 2060 | 1400 | 807 | 207 | 253 | 275 | 283 | 317 | 714.42 |
| 1953 | 339 | 338 | 364 | 639 | 815 | 533 | 346 | 215 | 237 | 277 | 318 | 390 | 400.92 |
| 1954 | 415 | 436 | 632 | 1170 | 1070 | 703 | 472 | 357 | 400 | 394 | 398 | 498 | 578.75 |
| 1955 | 515 | 497 | 468 | 377 | 438 | 415 | 245 | 264 | 285 | 385 | 381 | 578 | 404 |
| 1956 | 425 | 428 | 508 | 1010 | 1150 | 1020 | 298 | 236 | 408 | 426 | 416 | 533 | 571.5 |
| 1957 | 645 | 768 | 873 | 898 | 735 | 742 | 399 | 270 | 302 | 400 | 532 | 547 | 592.58 |
| 1958 | 548 | 485 | 460 | 461 | 494 | 562 | 287 | 228 | 345 | 414 | 514 | 564 | 446.83 |
| 1959 | 518 | 493 | 566 | 795 | 771 | 949 | 499 | 350 | 549 | 505 | 592 | 834 | 618.42 |
| 1960 | 793 | 722 | 718 | 974 | 1140 | 619 | 418 | 308 | 488 | 530 | 493 | 539 | 645.17 |
| 1961 | 661 | 693 | 593 | 470 | 442 | 304 | 229 | 261 | 370 | 372 | 327 | 452 | 431.17 |
| 1962 | 368 | 296 | 283 | 321 | 384 | 321 | 185 | 198 | 217 | 304 | 459 | 450 | 315.5 |
| 1963 | 428 | 345 | 348 | 712 | 1350 | 1500 | 975 | 837 | 727 | 567 | 601 | 719 | 759.08 |
| 1964 | 889 | 980 | 1080 | 1350 | 1150 | 643 | 349 | 318 | 364 | 478 | 411 | 540 | 712.67 |
| 1965 | 579 | 480 | 512 | 699 | 883 | 597 | 448 | 337 | 355 | 597 | 588 | 667 | 561.83 |
| 1966 | 756 | 649 | 503 | 653 | 932 | 454 | 316 | 301 | 365 | 514 | 413 | 462 | 526.5 |
| 1967 | 527 | 601 | 672 | 645 | 1080 | 540 | 282 | 246 | 389 | 369 | 453 | 520 | 527 |
| 1968 | 584 | 640 | 680 | 1190 | 1260 | 1260 | 679 | 496 | 455 | 455 | 530 | 618 | 737.25 |
| 1969 | 752 | 930 | 979 | 1350 | 1870 | 830 | -9999 | -9999 | -9999 | -9999 | -9999 | -9999 | -9999 |
| 1970 | 607 | 687 | 659 | 634 | 373 | 227 | 183 | 194 | 264 | 250 | 232 | 279 | 382.42 |
| 1971 | 333 | 288 | 318 | 232 | 223 | 206 | 178 | 231 | 220 | 222 | 237 | 245 | 244.42 |
| 1972 | 372 | 622 | 564 | 540 | 597 | 567 | 287 | 392 | 375 | 306 | 396 | 528 | 462.17 |
| 1973 | 623 | 623 | 596 | 629 | 648 | 710 | 510 | 405 | 392 | 337 | 427 | 583 | 540.25 |
| 1974 | 654 | 652 | 635 | 775 | 618 | 399 | 389 | 332 | 442 | 346 | 311 | 458 | 500.92 |
| 1975 | 441 | 546 | 484 | 491 | 664 | 469 | 347 | 416 | 290 | 384 | 311 | 396 | 436.58 |
| 1976 | 502 | 613 | 645 | 582 | 1000 | 1360 | 697 | 468 | 469 | 470 | 458 | 589 | 654.42 |
| 1977 | 726 | 667 | 551 | 491 | 355 | 418 | 328 | 311 | 307 | 360 | 461 | 601 | 464.67 |
| 1978 | 640 | 509 | 468 | 646 | 1040 | 1390 | 841 | 511 | 470 | 372 | 524 | 628 | 669.92 |
| 1979 | 737 | 659 | 472 | 381 | 273 | 477 | 342 | 401 | 359 | 302 | 318 | 399 | 426.67 |
| 1980 | 583 | 576 | 458 | 490 | 459 | 331 | 279 | 324 | 248 | 256 | 295 | 340 | 386.58 |
| 1981 | 258 | 190 | 273 | 427 | 450 | 382 | 318 | 409 | 256 | 288 | 388 | 494 | 344.42 |
| 1982 | 551 | 695 | 620 | 491 | 653 | 480 | 333 | 441 | 308 | 527 | 670 | 585 | 529.5 |
| 1983 | 538 | 563 | 571 | 398 | 349 | 328 | 354 | 316 | 286 | 303 | 376 | 638 | 418.33 |
| 1984 | 488 | 757 | 871 | 702 | 969 | 514 | 360 | 399 | 312 | 340 | 605 | 709 | 585.5 |
| |
|
|
|
|
|
|
|
|
|
|
|
|
|
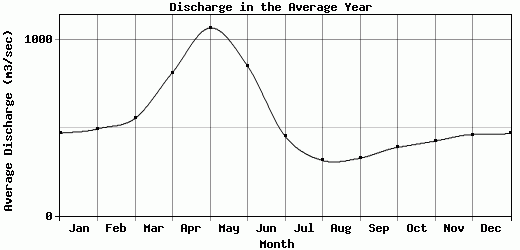
| Avg | 467.91 | 493.44 | 552.96 | 813.29 | 1067.24 | 850.8 | 451.69 | 313.74 | 326.7 | 387.93 | 423.8 | 460.98 | 547.07 |
| |
|
|
|
|
|
|
|
|
|
|
|
|
|
| Std Dev | 157.37 |
169.07 |
166.68 |
329.54 |
522.54 |
449.08 |
210.89 |
122.88 |
106.58 |
116.98 |
122.49 |
132.28 |
122.11 |
| |
|
|
|
|
|
|
|
|
|
|
|
|
|
| | Jan | Feb | Mar | Apr | May | Jun | Jul | Aug | Sep | Oct | Nov | Dec | Avg Annual |
Click here for this table in tab-delimited format.
Tab-delimited format will open in most table browsing software, i.e. Excel, etc.
View this station on the map.
Return to start.