Results
| Country: | U.S.A.
| | Station: | CROOKED CREEK AK | | River: | KUSKOKWIM R | | Area: | 80544.23 | | Lat: | 61.87 | | Lon: | -158.1 | | Source: | USGS | | PointID: | 15304000 | | Area Units: | km2 | | Discharge Units: | m3/sec | | Starting Year: | 1977 | | Ending Year: | 1993 | | Total Years: | 17 | | Total Usable Years: | 16 | |
| |
| Year | Jan | Feb | Mar | Apr | May | Jun | Jul | Aug | Sep | Oct | Nov | Dec | Avg Annual |
|---|
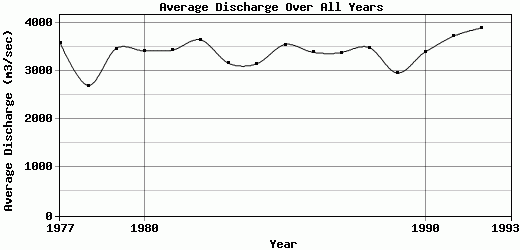
| 1977 | 1066.91 | 908.17 | 808.4 | 787.21 | 4686.92 | 12654.9 | 6467.24 | 4800.19 | 4131.45 | 3589.87 | 1972.75 | 1258.74 | 3594.4 |
| 1978 | 887.88 | 683.65 | 573.65 | 519.14 | 2909.34 | 7956.13 | 6575.02 | 4700.62 | 3300.82 | 2220.78 | 1241.23 | 857.73 | 2702.17 |
| 1979 | 760.91 | 707.92 | 656.77 | 642.8 | 6472.72 | 8097.72 | 7664.77 | 6771.42 | 4554.32 | 2929.62 | 1449.83 | 944.51 | 3471.11 |
| 1980 | 805.66 | 729.41 | 659.51 | 662.62 | 6229.74 | 8453.57 | 5782.15 | 6722.09 | 5161.25 | 3112.13 | 1629.17 | 1125.37 | 3422.72 |
| 1981 | 994.75 | 910.19 | 820.28 | 797.6 | 7161.46 | 7530.44 | 6576.85 | 6555.84 | 4196.58 | 2947.62 | 1620.68 | 1118.98 | 3435.94 |
| 1982 | 979.22 | 745.34 | 554.47 | 486.11 | 5598.54 | 13868.7 | 6939.49 | 5101.63 | 3810.52 | 2605.9 | 1717.9 | 1372 | 3648.32 |
| 1983 | 1055.95 | 800.97 | 659.51 | 553.13 | 4360.82 | 9479.59 | 6353.06 | 5473.4 | 4526.95 | 2500.3 | 1288.42 | 907.97 | 3163.34 |
| 1984 | 713.41 | 592.7 | 543.5 | 760.78 | 4818.46 | 8623.47 | 7165.11 | 5985.85 | 4014.41 | 2143.14 | 1410.19 | 1063.26 | 3152.86 |
| 1985 | 847.68 | 724.11 | 635.76 | 566.34 | 5268.79 | 11732.7 | 7713.19 | 5147.3 | 4929.05 | 2696.33 | 1291.25 | 1074.22 | 3552.23 |
| 1986 | 922.59 | 823.22 | 754.51 | 698.49 | 3693.09 | 9638.16 | 7455.59 | 6243.44 | 4935.65 | 2726.65 | 1663.15 | 1141.81 | 3391.36 |
| 1987 | 911.62 | 764.56 | 661.34 | 622.97 | 4410.14 | 10245.1 | 6488.25 | 5956.62 | 4846.93 | 3132.04 | 1568.76 | 1037.68 | 3387.17 |
| 1988 | 838.55 | 728.43 | 668.65 | 630.53 | 6614.3 | 8998.2 | 7154.15 | 6599.69 | 5218.82 | 2488.61 | 1060 | 887.87 | 3490.65 |
| 1989 | 787.4 | 708.94 | 633.02 | 673.94 | 7086.56 | 8658.39 | 5693.54 | 4032.89 | 3300.25 | 2225.26 | 977.88 | 758.16 | 2961.35 |
| 1990 | 667.73 | 604.77 | 550.81 | 607.87 | 7880.35 | 8597.99 | 5781.23 | 4560.86 | 5709.65 | 3609.05 | 1356.38 | 944.51 | 3405.93 |
| 1991 | 773.69 | 677.59 | 625.71 | 625.81 | 10563.2 | 7706.94 | 6066.23 | 6448.06 | 4717.61 | 3588.95 | 1710.35 | 1245.95 | 3729.17 |
| 1992 | 1005.71 | 854.39 | 763.65 | 714.53 | 2567.71 | 17389.5 | 9067.83 | 5855.22 | 4347.6 | 2133.27 | 1146.84 | 947.25 | 3899.46 |
| 1993 | -9999 | -9999 | -9999 | -9999 | -9999 | -9999 | -9999 | -9999 | -9999 | -9999 | -9999 | -9999 | -9999 |
| |
|
|
|
|
|
|
|
|
|
|
|
|
|
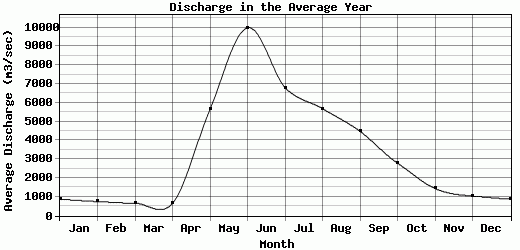
| Avg | 876.23 | 747.77 | 660.6 | 646.87 | 5645.13 | 9976.97 | 6808.98 | 5684.7 | 4481.37 | 2790.6 | 1444.05 | 1042.88 | 3400.51 |
| |
|
|
|
|
|
|
|
|
|
|
|
|
|
| Std Dev | 117.93 |
90.2 |
84.43 |
87.99 |
1955.95 |
2601.49 |
857.91 |
842.52 |
651.76 |
495.49 |
262.82 |
159.3 |
284.19 |
| |
|
|
|
|
|
|
|
|
|
|
|
|
|
| | Jan | Feb | Mar | Apr | May | Jun | Jul | Aug | Sep | Oct | Nov | Dec | Avg Annual |
Click here for this table in tab-delimited format.
Tab-delimited format will open in most table browsing software, i.e. Excel, etc.
View this station on the map.
Return to start.