Results
| Country: | U.S.S.R.
| | Station: | Kusur | | River: | Lena | | Area: | 2430000 km2 | | Lat: | 70.89 | | Lon: | 127.41 | | Source: | RivDIS | | PointID: | 930 | | Area Units: | km2 | | Discharge Units: | m3/sec | | Starting Year: | 1935 | | Ending Year: | 1984 | | Total Years: | 50 | | Total Usable Years: | 50 | |
| |
| Year | Jan | Feb | Mar | Apr | May | Jun | Jul | Aug | Sep | Oct | Nov | Dec | Avg Annual |
|---|
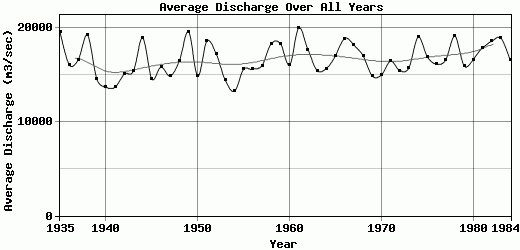
| 1935 | 3130 | 2480 | 1400 | 1310 | 4720 | 71100 | 48400 | 32500 | 40500 | 22600 | 3690 | 2980 | 19567.5 |
| 1936 | 2910 | 2130 | 1520 | 1210 | 7310 | 63700 | 37900 | 23200 | 27300 | 18200 | 3940 | 3400 | 16060 |
| 1937 | 3320 | 2420 | 1620 | 1160 | 4530 | 64300 | 33500 | 27300 | 36000 | 19100 | 3270 | 2770 | 16607.5 |
| 1938 | 2960 | 2020 | 1340 | 914 | 4640 | 84400 | 52700 | 39600 | 22900 | 13300 | 3020 | 2670 | 19205.3 |
| 1939 | 2470 | 1460 | 1030 | 1120 | 5210 | 70500 | 28800 | 27700 | 20800 | 10800 | 2250 | 2720 | 14571.7 |
| 1940 | 2430 | 1410 | 903 | 429 | 563 | 64700 | 33100 | 26800 | 19600 | 9830 | 2200 | 2040 | 13667.1 |
| 1941 | 2390 | 1770 | 1360 | 1100 | 2380 | 77900 | 30800 | 16000 | 15900 | 9880 | 2260 | 2320 | 13671.7 |
| 1942 | 1980 | 1370 | 1100 | 1010 | 2790 | 62500 | 38800 | 26600 | 28000 | 11300 | 2590 | 2570 | 15050.8 |
| 1943 | 2290 | 1020 | 970 | 829 | 32000 | 44400 | 35200 | 22900 | 20900 | 19400 | 2620 | 1960 | 15374.1 |
| 1944 | 2020 | 1120 | 692 | 877 | 4200 | 95900 | 41400 | 34000 | 26600 | 13800 | 3540 | 2760 | 18909.1 |
| 1945 | 2540 | 1800 | 1080 | 798 | 3060 | 66400 | 30800 | 29100 | 24400 | 10100 | 2410 | 2080 | 14547.3 |
| 1946 | 1530 | 1390 | 1160 | 1000 | 1120 | 62200 | 47900 | 30400 | 24300 | 13600 | 2770 | 2250 | 15801.7 |
| 1947 | 2530 | 1870 | 1400 | 1200 | 7360 | 72700 | 29300 | 13600 | 21000 | 20000 | 4950 | 2430 | 14861.7 |
| 1948 | 2110 | 1490 | 1210 | 1080 | 3090 | 80400 | 32200 | 27100 | 25600 | 16300 | 4020 | 2940 | 16461.7 |
| 1949 | 3310 | 2470 | 2040 | 1600 | 4240 | 91300 | 39600 | 25500 | 34700 | 21700 | 5180 | 3150 | 19565.8 |
| 1950 | 2870 | 2140 | 1450 | 1190 | 2680 | 74000 | 30900 | 25400 | 21700 | 10800 | 2330 | 2450 | 14825.8 |
| 1951 | 2210 | 1560 | 1090 | 895 | 2210 | 83000 | 44000 | 34600 | 29800 | 18200 | 2830 | 2270 | 18555.4 |
| 1952 | 2600 | 2220 | 1610 | 1270 | 5220 | 78200 | 42500 | 26400 | 26700 | 13100 | 3520 | 3350 | 17224.2 |
| 1953 | 2900 | 1960 | 1290 | 1130 | 10200 | 66100 | 26400 | 19200 | 22600 | 15800 | 2720 | 2560 | 14405 |
| 1954 | 2500 | 1760 | 1260 | 955 | 1180 | 61900 | 39600 | 18300 | 17600 | 9250 | 2300 | 2200 | 13233.8 |
| 1955 | 1950 | 1360 | 948 | 776 | 1900 | 87600 | 29400 | 25600 | 21700 | 11100 | 2350 | 2050 | 15561.2 |
| 1956 | 1890 | 1470 | 1040 | 887 | 951 | 66400 | 45300 | 21800 | 27300 | 12600 | 3700 | 3490 | 15569 |
| 1957 | 2980 | 2250 | 1570 | 1180 | 2940 | 80500 | 32900 | 31000 | 15700 | 12900 | 4740 | 2920 | 15965 |
| 1958 | 2570 | 2250 | 1670 | 1350 | 2580 | 79400 | 49300 | 36300 | 21000 | 16300 | 3550 | 3140 | 18284.2 |
| 1959 | 2950 | 2160 | 1650 | 1330 | 4350 | 80700 | 33600 | 32600 | 35300 | 18400 | 3490 | 3070 | 18300 |
| 1960 | 3060 | 2160 | 1400 | 1120 | 2970 | 65100 | 36300 | 27600 | 30000 | 15400 | 3620 | 3410 | 16011.7 |
| 1961 | 3260 | 2680 | 2050 | 1660 | 2040 | 80400 | 56100 | 37800 | 29200 | 17600 | 3540 | 3400 | 19977.5 |
| 1962 | 3460 | 2690 | 1900 | 1510 | 4770 | 84600 | 52200 | 27300 | 16000 | 11000 | 3910 | 2500 | 17653.3 |
| 1963 | 2390 | 1840 | 1580 | 1410 | 1410 | 72900 | 52700 | 18400 | 15600 | 10100 | 4130 | 2800 | 15438.3 |
| 1964 | 2700 | 2240 | 1680 | 1350 | 2220 | 82000 | 42300 | 24600 | 14600 | 9020 | 2590 | 2510 | 15650.8 |
| 1965 | 2380 | 1630 | 1150 | 721 | 2320 | 62900 | 45500 | 28400 | 26800 | 16400 | 9360 | 6530 | 17007.6 |
| 1966 | 2220 | 1570 | 1090 | 907 | 4380 | 93100 | 49200 | 28200 | 25400 | 12700 | 4500 | 2930 | 18849.8 |
| 1967 | 2600 | 1830 | 1260 | 1170 | 16200 | 96600 | 26100 | 25800 | 21800 | 17400 | 4590 | 2480 | 18152.5 |
| 1968 | 2390 | 2010 | 1670 | 1230 | 28800 | 70200 | 37700 | 21800 | 19100 | 13000 | 3520 | 2870 | 17024.2 |
| 1969 | 2460 | 1580 | 1200 | 942 | 1240 | 75900 | 41100 | 22400 | 16800 | 9860 | 2910 | 1970 | 14863.5 |
| 1970 | 1850 | 1430 | 1160 | 1020 | 2210 | 78700 | 46600 | 18300 | 21900 | 2300 | 1900 | 2070 | 14953.3 |
| 1971 | 2210 | 1610 | 1360 | 1060 | 5130 | 77500 | 28400 | 24900 | 32100 | 16200 | 3500 | 3310 | 16440 |
| 1972 | 2830 | 2400 | 1690 | 1310 | 2350 | 63500 | 34400 | 30200 | 27300 | 13600 | 2870 | 2680 | 15427.5 |
| 1973 | 2470 | 1620 | 1230 | 1070 | 4280 | 59100 | 33800 | 39500 | 31000 | 9340 | 2910 | 2410 | 15727.5 |
| 1974 | 2270 | 1880 | 1400 | 994 | 2530 | 84800 | 52000 | 38300 | 23200 | 13600 | 4050 | 2990 | 19001.2 |
| 1975 | 2360 | 2010 | 1600 | 1260 | 15500 | 68000 | 34700 | 25200 | 32800 | 13600 | 3410 | 2320 | 16896.7 |
| 1976 | 2570 | 2030 | 1480 | 1340 | 2350 | 66000 | 50100 | 24500 | 26500 | 11400 | 3010 | 1940 | 16101.7 |
| 1977 | 1640 | 1480 | 1320 | 1340 | 6070 | 71200 | 40700 | 28800 | 26300 | 15600 | 2340 | 1890 | 16556.7 |
| 1978 | 2030 | 1870 | 1580 | 1220 | 1840 | 87100 | 58100 | 35200 | 23100 | 11700 | 2720 | 2620 | 19090 |
| 1979 | 2840 | 2630 | 1780 | 1400 | 4680 | 74900 | 25000 | 22200 | 32600 | 15200 | 4220 | 3820 | 15939.2 |
| 1980 | 3920 | 2780 | 2010 | 1610 | 3270 | 72400 | 52300 | 28300 | 17400 | 9170 | 3120 | 2910 | 16599.2 |
| 1981 | 2880 | 2700 | 2350 | 1780 | 9520 | 60500 | 38700 | 36200 | 34400 | 18300 | 3520 | 3130 | 17831.7 |
| 1982 | 3790 | 2670 | 2180 | 1840 | 4960 | 74100 | 47100 | 32200 | 32000 | 14600 | 3170 | 3980 | 18549.2 |
| 1983 | 3610 | 2810 | 2280 | 2040 | 4930 | 71800 | 44800 | 31700 | 33300 | 21500 | 3890 | 4230 | 18907.5 |
| 1984 | 3930 | 3350 | 2780 | 2230 | 21500 | 76300 | 29900 | 24100 | 16100 | 10500 | 3950 | 4450 | 16590.8 |
| |
|
|
|
|
|
|
|
|
|
|
|
|
|
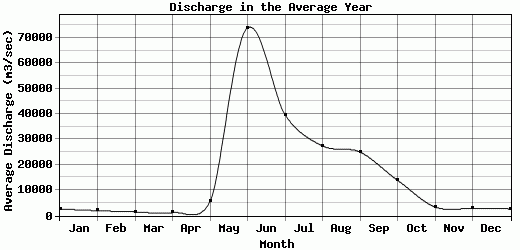
| Avg | 2629.2 | 1977 | 1471.66 | 1202.68 | 5577.88 | 73996 | 39802 | 27508 | 25064 | 13949 | 3429.8 | 2853.8 | 16621.8 |
| |
|
|
|
|
|
|
|
|
|
|
|
|
|
| Std Dev | 552.91 |
497.5 |
407.13 |
331.43 |
6423.3 |
10389.6 |
8715.72 |
6011.65 |
6279.96 |
3993.67 |
1145.15 |
788.47 |
1726.61 |
| |
|
|
|
|
|
|
|
|
|
|
|
|
|
| | Jan | Feb | Mar | Apr | May | Jun | Jul | Aug | Sep | Oct | Nov | Dec | Avg Annual |
Click here for this table in tab-delimited format.
Tab-delimited format will open in most table browsing software, i.e. Excel, etc.
View this station on the map.
Return to start.