Results
| Country: | U.S.A.
| | Station: | WATFORD CITY, ND | | River: | LITTLE MISSOURI RIVER | | Area: | 26183878.93 | | Lat: | 47.59 | | Lon: | -103.26 | | Source: | USGS | | PointID: | 6337000 | | Area Units: | km2 | | Discharge Units: | m3/sec | | Starting Year: | 1972 | | Ending Year: | 1996 | | Total Years: | 25 | | Total Usable Years: | 24 | |
| |
| Year | Jan | Feb | Mar | Apr | May | Jun | Jul | Aug | Sep | Oct | Nov | Dec | Avg Annual |
|---|
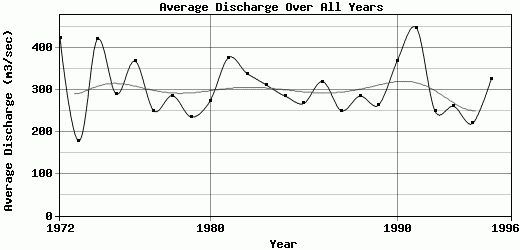
| 1972 | 71.07 | 86.51 | 111.99 | 160.56 | 531.35 | 883.68 | 571.18 | 373.14 | 592.86 | 909.16 | 700.85 | 98.1 | 424.2 |
| 1973 | 87.33 | 87.58 | 94.18 | 92.97 | 79.84 | 116.76 | 155.93 | 298.52 | 547.56 | 284.17 | 221.96 | 74.74 | 178.46 |
| 1974 | 250.42 | 510.01 | 308.77 | 321.49 | 459.65 | 512.1 | 490.94 | 353.67 | 326.23 | 637.5 | 503.57 | 378.53 | 421.07 |
| 1975 | 434.25 | 581.91 | 293.48 | 128.79 | 196.39 | 116.83 | 94.02 | 79.89 | 222.66 | 329.43 | 478.75 | 526.06 | 290.21 |
| 1976 | 688.29 | 466.84 | 366.42 | 179.25 | 98.32 | 128.11 | 417.63 | 522.77 | 314.17 | 439.83 | 405.81 | 398.36 | 368.82 |
| 1977 | 343.39 | 272.34 | 275.11 | 235.12 | 136.8 | 111.84 | 284.71 | 215.23 | 188.1 | 283.42 | 446.68 | 209.08 | 250.15 |
| 1978 | 306.59 | 260.34 | 115.94 | 87.91 | 99.46 | 221.65 | 350.26 | 261.69 | 294.59 | 348.89 | 537.27 | 553.24 | 286.49 |
| 1979 | 454.39 | 143.74 | 112.23 | 95.58 | 83.6 | 108.21 | 100.28 | 158.75 | 216.93 | 367.79 | 558.03 | 430.09 | 235.8 |
| 1980 | 322.38 | 192.67 | 106.79 | 91.77 | 89.18 | 413.4 | 291.7 | 215.91 | 215.87 | 406.24 | 453.91 | 481.1 | 273.41 |
| 1981 | 549.61 | 492.92 | 192.1 | 82.89 | 88.91 | 396.84 | 773.97 | 388.96 | 261.21 | 364.98 | 388.74 | 545.55 | 377.22 |
| 1982 | 537.08 | 386.5 | 239.55 | 212.1 | 337.16 | 152.35 | 250.78 | 290.31 | 240.8 | 373.41 | 568.32 | 470.43 | 338.23 |
| 1983 | 554.65 | 460.14 | 184.66 | 127.93 | 165.28 | 114.47 | 308.55 | 282 | 286.33 | 353.32 | 326.02 | 582.14 | 312.12 |
| 1984 | 518.21 | 209.98 | 120.2 | 115.51 | 104.05 | 107.92 | 282.91 | 342.64 | 254.84 | 353.26 | 435.87 | 585.43 | 285.9 |
| 1985 | 549.59 | 186.17 | 113.01 | 87.02 | 86.02 | 91.07 | 145.68 | 188.52 | 316.16 | 533.18 | 541.02 | 377.41 | 267.9 |
| 1986 | 482.24 | 114.27 | 126.11 | 118.64 | 88.15 | 306.79 | 453.73 | 246.87 | 453.92 | 693.49 | 584.42 | 175.41 | 320.34 |
| 1987 | 316 | 259.45 | 109.8 | 85.9 | 85.69 | 105.72 | 230.2 | 261.09 | 371.02 | 584.06 | 347.25 | 254.01 | 250.85 |
| 1988 | 550.13 | 411.67 | 124.59 | 85.06 | 83.6 | 85.39 | 89.48 | 118.36 | 492.56 | 425.26 | 465.8 | 492.45 | 285.36 |
| 1989 | 243.64 | 242.19 | 92.97 | 85.49 | 85.32 | 94.27 | 136.65 | 486.45 | 250.67 | 488.58 | 456.2 | 512 | 264.54 |
| 1990 | 156.26 | 630.66 | 352.08 | 182.5 | 112.83 | 432.26 | 497.48 | 304 | 268.78 | 547.46 | 274.57 | 689.36 | 370.69 |
| 1991 | 684.63 | 551.17 | 278.65 | 259.87 | 259.63 | 372.03 | 518.56 | 378.41 | 376.4 | 541.04 | 705.67 | 455.03 | 448.42 |
| 1992 | 131.33 | 113.09 | 103.84 | 150.79 | 221.05 | 226.32 | 113.83 | 249.42 | 451.25 | 346.8 | 504.69 | 382.4 | 249.57 |
| 1993 | 203.1 | 194.51 | 227.26 | 113.83 | 125.21 | 291.99 | 111.61 | 132.62 | 254.95 | 408.81 | 517.63 | 552.73 | 261.19 |
| 1994 | 238.38 | 109.78 | 110.72 | 108.08 | 234.58 | 483.56 | 166.43 | 116.02 | 147.27 | 274.56 | 388.77 | 263.2 | 220.11 |
| 1995 | 450.19 | 138.38 | 112.08 | 120.46 | 392.45 | 558.22 | 234.04 | 384.5 | 189.94 | 182.91 | 524.34 | 624.97 | 326.04 |
| 1996 | -9999 | -9999 | -9999 | -9999 | -9999 | -9999 | -9999 | -9999 | -9999 | -9999 | -9999 | -9999 | -9999 |
| |
|
|
|
|
|
|
|
|
|
|
|
|
|
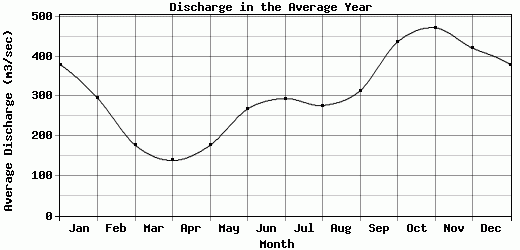
| Avg | 380.13 | 295.95 | 178.02 | 138.73 | 176.86 | 267.99 | 294.61 | 277.07 | 313.96 | 436.56 | 472.34 | 421.33 | 304.46 |
| |
|
|
|
|
|
|
|
|
|
|
|
|
|
| Std Dev | 178.69 |
171.29 |
88.09 |
62.26 |
127.69 |
198.94 |
177.82 |
112.13 |
115.23 |
155.56 |
113.91 |
162.86 |
67.06 |
| |
|
|
|
|
|
|
|
|
|
|
|
|
|
| | Jan | Feb | Mar | Apr | May | Jun | Jul | Aug | Sep | Oct | Nov | Dec | Avg Annual |
Click here for this table in tab-delimited format.
Tab-delimited format will open in most table browsing software, i.e. Excel, etc.
View this station on the map.
Return to start.