Results
| Country: | Central_African_Rep.
| | Station: | M'Bata | | River: | Lobaye | | Area: | 31000 km2 | | Lat: | 3.66 | | Lon: | 18.3 | | Source: | RivDIS | | PointID: | 32 | | Area Units: | km2 | | Discharge Units: | m3/sec | | Starting Year: | 1950 | | Ending Year: | 1984 | | Total Years: | 35 | | Total Usable Years: | 32 | |
| |
| Year | Jan | Feb | Mar | Apr | May | Jun | Jul | Aug | Sep | Oct | Nov | Dec | Avg Annual |
|---|
| 1950 | -9999 | -9999 | -9999 | -9999 | -9999 | -9999 | -9999 | -9999 | -9999 | -9999 | 476 | 303 | -9999 |
| 1951 | 268 | 246 | 255 | 237 | 252 | 277 | 287 | 404 | -9999 | -9999 | -9999 | -9999 | -9999 |
| 1952 | -9999 | -9999 | -9999 | -9999 | -9999 | -9999 | 373 | 468 | 528 | 562 | 514 | 341 | -9999 |
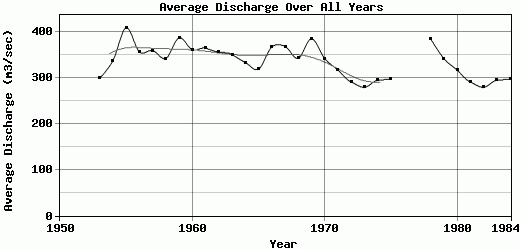
| 1953 | 280 | 261 | 275 | 257 | 261 | 269 | 278 | 287 | 341 | 394 | 408 | 281 | 299.33 |
| 1954 | 256 | 260 | 256 | 251 | 266 | 296 | 323 | 319 | 467 | 517 | 495 | 348 | 337.83 |
| 1955 | 278 | 268 | 268 | 291 | 285 | 286 | 358 | 535 | 599 | 688 | 627 | 431 | 409.5 |
| 1956 | 335 | 301 | 338 | 317 | 295 | 317 | 344 | 349 | 432 | 493 | 419 | 346 | 357.17 |
| 1957 | 283 | 260 | 266 | 280 | 282 | 320 | 345 | 414 | 507 | 487 | 467 | 411 | 360.17 |
| 1958 | 311 | 280 | 271 | 292 | 322 | 311 | 290 | 328 | 393 | 453 | 476 | 386 | 342.75 |
| 1959 | 309 | 275 | 261 | 276 | 314 | 298 | 388 | 426 | 539 | 580 | 583 | 402 | 387.58 |
| 1960 | 312 | 285 | 286 | 291 | 289 | 291 | 306 | 347 | 487 | 550 | 523 | 372 | 361.58 |
| 1961 | 316 | 277 | 259 | 273 | 294 | 284 | 328 | 343 | 560 | 613 | 497 | 338 | 365.17 |
| 1962 | 287 | 271 | 272 | 280 | 288 | 297 | 325 | 360 | 464 | 512 | 525 | 395 | 356.33 |
| 1963 | 311 | 294 | 288 | 303 | 324 | 302 | 327 | 455 | 450 | 442 | 403 | 317 | 351.33 |
| 1964 | 286 | 262 | 263 | 285 | 272 | 294 | 301 | 295 | 436 | 537 | 454 | 324 | 334.08 |
| 1965 | 280 | 265 | 264 | 263 | 263 | 280 | 294 | 361 | 404 | 460 | 407 | 290 | 319.25 |
| 1966 | 264 | 252 | 250 | 265 | 284 | 323 | 335 | 405 | 531 | 547 | 560 | 395 | 367.58 |
| 1967 | 303 | 283 | 263 | 252 | 261 | 359 | 439 | 375 | 512 | 569 | 473 | 340 | 369.08 |
| 1968 | 303 | 268 | 259 | 261 | 293 | 311 | 403 | 461 | 205 | 494 | 482 | 376 | 343 |
| 1969 | 289 | 260 | 306 | 293 | 284 | 313 | 377 | 464 | 546 | 597 | 529 | 370 | 385.67 |
| 1970 | 299 | 268 | 265 | 261 | 272 | 275 | 296 | 421 | 479 | 527 | 450 | 301 | 342.83 |
| 1971 | 268 | 247 | 246 | 255 | 229 | 262 | 306 | 342 | 450 | 495 | 403 | 308 | 317.58 |
| 1972 | 247 | 220 | 218 | 242 | 221 | 261 | 275 | 344 | 342 | 468 | 393 | 269 | 291.67 |
| 1973 | 251 | 219 | 207 | 219 | 224 | 241 | 241 | 361 | 407 | 406 | 329 | 252 | 279.75 |
| 1974 | 211 | 186 | 193 | 190 | 229 | 245 | 245 | 308 | 480 | 498 | 455 | 302 | 295.17 |
| 1975 | 239 | 217 | 208 | 217 | 230 | 217 | 259 | 362 | 389 | 509 | 426 | 302 | 297.92 |
| 1976 | -9999 | -9999 | -9999 | -9999 | 190 | 185 | 253 | 270 | 337 | 446 | 392 | 229 | -9999 |
| 1977 | 180 | 148 | 159 | -9999 | -9999 | -9999 | -9999 | -9999 | -9999 | -9999 | -9999 | -9999 | -9999 |
| 1978 | 289 | 260 | 306 | 293 | 284 | 313 | 377 | 464 | 546 | 597 | 529 | 370 | 385.67 |
| 1979 | 299 | 268 | 265 | 261 | 272 | 275 | 296 | 421 | 479 | 527 | 450 | 301 | 342.83 |
| 1980 | 268 | 247 | 246 | 255 | 229 | 262 | 306 | 342 | 450 | 495 | 403 | 308 | 317.58 |
| 1981 | 247 | 220 | 218 | 242 | 221 | 261 | 275 | 344 | 342 | 468 | 393 | 269 | 291.67 |
| 1982 | 251 | 219 | 207 | 219 | 224 | 241 | 241 | 361 | 407 | 406 | 329 | 252 | 279.75 |
| 1983 | 211 | 186 | 193 | 190 | 229 | 245 | 245 | 308 | 480 | 498 | 455 | 302 | 295.17 |
| 1984 | 239 | 217 | 208 | 217 | 230 | 217 | 259 | 362 | 389 | 509 | 426 | 302 | 297.92 |
| |
|
|
|
|
|
|
|
|
|
|
|
|
|
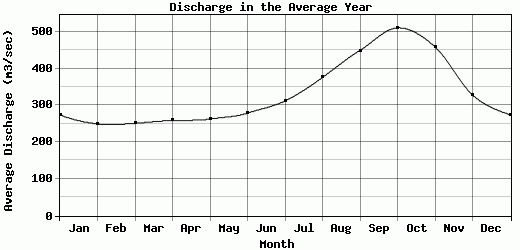
| Avg | 274.06 | 249.69 | 251.22 | 258.97 | 262.91 | 279 | 311.97 | 375.94 | 449.31 | 510.75 | 459.12 | 328.27 | 336.1 |
| |
|
|
|
|
|
|
|
|
|
|
|
|
|
| Std Dev | 34.02 |
33.66 |
37.19 |
31.27 |
33.18 |
35.73 |
49.88 |
60.6 |
81.15 |
63.18 |
66.26 |
49.82 |
35.24 |
| |
|
|
|
|
|
|
|
|
|
|
|
|
|
| | Jan | Feb | Mar | Apr | May | Jun | Jul | Aug | Sep | Oct | Nov | Dec | Avg Annual |
Click here for this table in tab-delimited format.
Tab-delimited format will open in most table browsing software, i.e. Excel, etc.
View this station on the map.
Return to start.