Results
| Country: | Chad
| | Station: | Bongor | | River: | Logone | | Area: | 73700 km2 | | Lat: | 10.27 | | Lon: | 15.42 | | Source: | RivDIS | | PointID: | 1478 | | Area Units: | km2 | | Discharge Units: | m3/sec | | Starting Year: | 1948 | | Ending Year: | 1982 | | Total Years: | 35 | | Total Usable Years: | 28 | |
| |
| Year | Jan | Feb | Mar | Apr | May | Jun | Jul | Aug | Sep | Oct | Nov | Dec | Avg Annual |
|---|
| 1948 | -9999 | -9999 | -9999 | -9999 | -9999 | -9999 | 600 | 1230 | 1840 | 1680 | 528 | -9999 | -9999 |
| 1949 | -9999 | -9999 | -9999 | -9999 | -9999 | -9999 | -9999 | 1180 | 1690 | 1760 | 681 | 226 | -9999 |
| 1950 | 134 | -9999 | -9999 | -9999 | -9999 | -9999 | 303 | 1100 | 1830 | 1800 | 529 | 213 | -9999 |
| 1951 | -9999 | -9999 | -9999 | -9999 | -9999 | 90 | 210 | 875 | 1490 | 1520 | 778 | 212 | -9999 |
| 1952 | -9999 | -9999 | -9999 | -9999 | -9999 | 107 | 249 | 1010 | 1800 | -9999 | -9999 | -9999 | -9999 |
| 1953 | 147 | 83 | 60 | -9999 | 61 | 96 | 314 | 932 | -9999 | 1490 | 449 | 192 | -9999 |
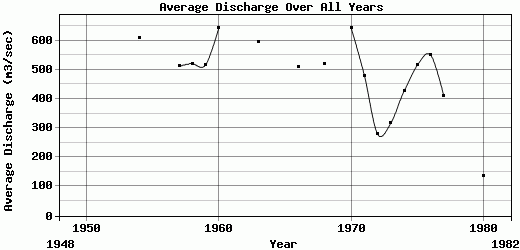
| 1954 | 116 | 79 | 55 | 50 | 61 | 223 | 638 | 1010 | 1790 | 1880 | 1070 | 333 | 608.75 |
| 1955 | 190 | 124 | -9999 | -9999 | 130 | 149 | 509 | 1220 | 1750 | 2310 | 1330 | 350 | -9999 |
| 1956 | 190 | -9999 | -9999 | -9999 | -9999 | 136 | 459 | 1150 | 1770 | 1960 | 687 | 215 | -9999 |
| 1957 | 127 | 92 | 58 | 58 | 97 | 248 | 513 | 1100 | 1630 | 1430 | 568 | 218 | 511.58 |
| 1958 | 107 | 71 | 52 | 46 | 58 | 211 | 746 | 913 | 1620 | 1600 | 619 | 204 | 520.58 |
| 1959 | 129 | 92 | 64 | 65 | 89 | 117 | 323 | 1030 | 1840 | 1760 | 504 | 183 | 516.33 |
| 1960 | 123 | 92 | 68 | 62 | 117 | 115 | 526 | 1290 | 1820 | 1970 | 1210 | 312 | 642.08 |
| 1961 | 160 | 106 | -9999 | 62.5 | 74 | 129 | 789 | 1270 | -9999 | 1960 | -9999 | 242 | -9999 |
| 1962 | 138 | 100 | -9999 | 99 | 107 | 132 | 404 | 751 | 1610 | 2120 | 771 | 285 | -9999 |
| 1963 | 133 | 91 | 69 | 60 | 131 | 111 | 492 | 1490 | 2020 | 1670 | 669 | 211 | 595.58 |
| 1964 | 129 | 81 | 62 | -9999 | -9999 | 125 | 407 | 1040 | 1700 | 1570 | 613 | 203 | -9999 |
| 1965 | 128 | 90 | -9999 | -9999 | 131 | -9999 | -9999 | -9999 | -9999 | -9999 | -9999 | -9999 | -9999 |
| 1966 | 95.4 | 60.2 | 51.4 | 55.4 | 86.4 | 137 | 356 | 881 | 1880 | 1500 | 766 | 263 | 510.98 |
| 1967 | 177 | -9999 | -9999 | 51.3 | 52.3 | 94.1 | 442 | 1300 | 1780 | 1780 | 464 | 263 | -9999 |
| 1968 | 113 | 78.1 | 51.4 | 39.1 | 96.1 | 200 | 713 | 1290 | 1860 | 1230 | 402 | 153 | 518.81 |
| 1969 | -9999 | -9999 | -9999 | 64.1 | 99.9 | 169 | 660 | 1480 | 2140 | 1890 | 719 | 264 | -9999 |
| 1970 | 165 | 125 | 93.5 | 85.7 | 116 | 143 | 533 | 1330 | 2420 | 1850 | 599 | 264 | 643.68 |
| 1971 | 87.8 | 62.5 | 40.4 | 39.8 | 38.2 | 67.1 | 541 | 1300 | 1810 | 1300 | 359 | 120 | 480.48 |
| 1972 | 80 | 55.3 | 32.3 | 33.6 | 54.8 | 131 | 178 | 718 | 879 | 800 | 287 | 102 | 279.25 |
| 1973 | 82.1 | 61.6 | 39.8 | 27.4 | 58.6 | 84.9 | 177 | 746 | 1190 | 986 | 257 | 94.7 | 317.09 |
| 1974 | 59.8 | 38.1 | 26.4 | 23.8 | 68.1 | 109 | 328 | 1080 | 1580 | 1210 | 435 | 156 | 426.18 |
| 1975 | 84.9 | 54.5 | 37.3 | 32.5 | 48.6 | 80.3 | 314 | 901 | 1750 | 1970 | 693 | 216 | 515.18 |
| 1976 | 102 | 65.4 | 43.6 | 31.7 | 36.9 | 97.9 | 527 | 1330 | 1940 | 1480 | 701 | 259 | 551.21 |
| 1977 | 141 | 92.7 | 67 | 47.6 | 51.8 | 104 | 420 | 1040 | 1590 | 951 | 287 | 135 | 410.59 |
| 1978 | 82.4 | 54 | 32.5 | -9999 | -9999 | -9999 | -9999 | -9999 | -9999 | -9999 | -9999 | -9999 | -9999 |
| 1979 | -9999 | -9999 | -9999 | -9999 | -9999 | 94.5 | 244 | 456 | 972 | 562 | 208 | 117 | -9999 |
| 1980 | 78 | 56.8 | 39.5 | 42 | 73.2 | 75.8 | 160 | 348 | 321 | 256 | 111 | 58 | 134.94 |
| 1981 | 40.6 | 26.9 | 16.5 | -9999 | -9999 | 44.9 | 308 | 643 | 760 | 443 | 190 | 96.6 | -9999 |
| 1982 | 70.9 | 51.3 | 37.1 | -9999 | -9999 | -9999 | -9999 | -9999 | -9999 | -9999 | -9999 | -9999 | -9999 |
| |
|
|
|
|
|
|
|
|
|
|
|
|
|
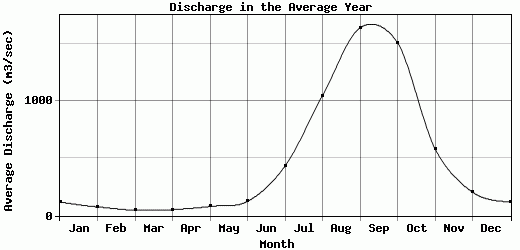
| Avg | 117.62 | 76.28 | 49.85 | 51.26 | 80.7 | 124.88 | 431.71 | 1044.81 | 1635.73 | 1506.06 | 582.8 | 205.34 | 481.37 |
| |
|
|
|
|
|
|
|
|
|
|
|
|
|
| Std Dev | 37.43 |
23.79 |
17.02 |
18.23 |
29.46 |
46.54 |
170.01 |
270.32 |
418.83 |
492.07 |
278.01 |
72.11 |
130.46 |
| |
|
|
|
|
|
|
|
|
|
|
|
|
|
| | Jan | Feb | Mar | Apr | May | Jun | Jul | Aug | Sep | Oct | Nov | Dec | Avg Annual |
Click here for this table in tab-delimited format.
Tab-delimited format will open in most table browsing software, i.e. Excel, etc.
View this station on the map.
Return to start.