Results
| Country: | Chad
| | Station: | Moundou | | River: | Logone | | Area: | 33970 km2 | | Lat: | 8.53 | | Lon: | 16.07 | | Source: | RivDIS | | PointID: | 1481 | | Area Units: | km2 | | Discharge Units: | m3/sec | | Starting Year: | 1935 | | Ending Year: | 1978 | | Total Years: | 44 | | Total Usable Years: | 28 | |
| |
| Year | Jan | Feb | Mar | Apr | May | Jun | Jul | Aug | Sep | Oct | Nov | Dec | Avg Annual |
|---|
| 1935 | -9999 | -9999 | -9999 | -9999 | -9999 | -9999 | 596 | 1425 | 1902 | 1233 | 329 | 171 | -9999 |
| 1936 | 94 | -9999 | -9999 | -9999 | -9999 | -9999 | 321 | 1209 | 1680 | 829 | 882 | 151 | -9999 |
| 1937 | 105 | -9999 | -9999 | -9999 | -9999 | -9999 | 220 | 736 | 1062 | 1447 | -9999 | -9999 | -9999 |
| 1938 | -9999 | -9999 | -9999 | -9999 | -9999 | -9999 | -9999 | -9999 | -9999 | -9999 | -9999 | -9999 | -9999 |
| 1939 | -9999 | -9999 | -9999 | -9999 | -9999 | -9999 | -9999 | -9999 | -9999 | -9999 | -9999 | -9999 | -9999 |
| 1940 | -9999 | -9999 | -9999 | -9999 | -9999 | -9999 | -9999 | 1123 | 1363 | 551 | 144 | -9999 | -9999 |
| 1941 | -9999 | -9999 | -9999 | -9999 | -9999 | -9999 | 325 | -9999 | -9999 | -9999 | -9999 | -9999 | -9999 |
| 1942 | -9999 | -9999 | -9999 | -9999 | -9999 | -9999 | 323 | 1310 | 1696 | 732 | 167 | -9999 | -9999 |
| 1943 | -9999 | -9999 | -9999 | -9999 | -9999 | -9999 | 355 | 1175 | 1645 | 1491 | 742 | 14 | -9999 |
| 1944 | -9999 | -9999 | -9999 | -9999 | -9999 | -9999 | -9999 | 377 | 945 | 662 | -9999 | -9999 | -9999 |
| 1945 | -9999 | -9999 | -9999 | -9999 | -9999 | -9999 | 232 | 2036 | 1164 | 1313 | -9999 | -9999 | -9999 |
| 1946 | -9999 | -9999 | -9999 | -9999 | -9999 | -9999 | -9999 | 651 | 1500 | 1499 | 361 | -9999 | -9999 |
| 1947 | -9999 | -9999 | -9999 | -9999 | -9999 | -9999 | 201 | 1750 | -9999 | -9999 | -9999 | -9999 | -9999 |
| 1948 | -9999 | -9999 | -9999 | -9999 | -9999 | -9999 | 336 | 1175 | 1389 | 742 | -9999 | -9999 | -9999 |
| 1949 | -9999 | -9999 | -9999 | -9999 | -9999 | -9999 | 600 | 907 | 1438 | -9999 | -9999 | -9999 | -9999 |
| 1950 | -9999 | -9999 | -9999 | -9999 | -9999 | -9999 | 303 | 1047 | 1539 | 868 | 263 | 173 | -9999 |
| 1951 | 116 | -9999 | -9999 | -9999 | -9999 | 95 | 209 | 858 | 908 | 877 | -9999 | -9999 | -9999 |
| 1952 | -9999 | -9999 | 55 | 46 | 94 | 95 | 263 | 853 | 1273 | 987 | 278 | 135 | -9999 |
| 1953 | 87 | 54 | 35 | 26 | 58 | -9999 | 300 | 604 | 1159 | 643 | 233 | 154 | -9999 |
| 1954 | 89 | -9999 | -9999 | -9999 | 81 | 222 | 495 | 767 | 1616 | 1312 | 442 | 198 | -9999 |
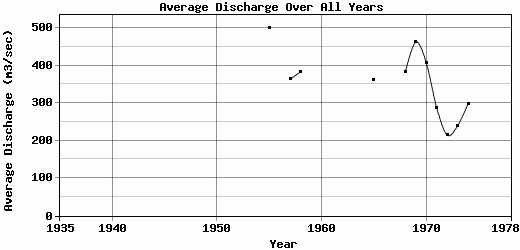
| 1955 | 100 | 76 | 34 | 43 | 112 | 130 | 385 | 1009 | 1497 | 1804 | 587 | 233 | 500.83 |
| 1956 | -9999 | -9999 | -9999 | -9999 | 77 | 151 | 365 | 807 | 1316 | 1473 | 327 | 151 | -9999 |
| 1957 | 99 | 70 | 43 | 62 | 135 | 251 | 440 | 866 | 1183 | 790 | 297 | 133 | 364.08 |
| 1958 | 74 | 42 | 31 | 56 | 80 | 268 | 581 | 667 | 1414 | 999 | 269 | 125 | 383.83 |
| 1959 | 84 | 69 | 47 | 59 | 101 | 129 | 380 | 973 | 1808 | 874 | 271 | -9999 | -9999 |
| 1960 | -9999 | -9999 | -9999 | 44 | 50 | 68 | -9999 | -9999 | -9999 | -9999 | -9999 | -9999 | -9999 |
| 1961 | 80 | 54 | 38 | 42 | 50 | 112 | 738 | 1200 | 1339 | -9999 | 192 | 80 | -9999 |
| 1962 | -9999 | -9999 | -9999 | -9999 | -9999 | -9999 | -9999 | -9999 | -9999 | -9999 | -9999 | -9999 | -9999 |
| 1963 | -9999 | -9999 | -9999 | -9999 | 105 | 105 | 434 | 1465 | 1207 | 1082 | 328 | -9999 | -9999 |
| 1964 | -9999 | 59 | 43 | -9999 | 113 | 163 | -9999 | 947 | 1693 | 937 | 329 | -9999 | -9999 |
| 1965 | 71 | 45 | 30 | 30 | 49 | 159 | 615 | 1171 | 1085 | 763 | 219 | 105 | 361.83 |
| 1966 | -9999 | -9999 | -9999 | -9999 | -9999 | -9999 | -9999 | -9999 | -9999 | -9999 | -9999 | -9999 | -9999 |
| 1967 | -9999 | -9999 | -9999 | -9999 | 45 | 102 | 577 | 899 | 1265 | 923 | 234 | 109 | -9999 |
| 1968 | 69 | 51 | 47 | 52 | 83 | 199 | 555 | 1405 | 1285 | 649 | 137 | 59 | 382.58 |
| 1969 | 41 | 31 | 52 | 34 | 81 | 151 | 560 | 1517 | 1794 | 855 | 274 | 163 | 462.75 |
| 1970 | 61 | 44 | 33 | 41 | 51 | 80 | 456 | 1424 | 1887 | 657 | 117 | 46 | 408.08 |
| 1971 | 32 | 20 | 13 | 18 | 40.3 | 73.1 | 548 | 707 | 1280 | 520 | 133 | 66.8 | 287.6 |
| 1972 | 39.1 | 29.3 | 22.9 | 61.2 | 31.2 | 199 | 258 | 658 | 544 | 561 | 130 | 44.5 | 214.85 |
| 1973 | 29.1 | 20.1 | 13.7 | 16.9 | 75.5 | 92.1 | 264 | 664 | 1020 | 547 | 93.8 | 44.2 | 240.03 |
| 1974 | 26 | 14.2 | 9.5 | 19.8 | 56.1 | 101 | 281 | 986 | 1120 | 703 | 185 | 77.5 | 298.26 |
| 1975 | 42.7 | 31.1 | 22.5 | 25 | -9999 | -9999 | -9999 | -9999 | -9999 | -9999 | -9999 | -9999 | -9999 |
| 1976 | -9999 | -9999 | -9999 | -9999 | 26.3 | 82 | 247 | 811 | 1406 | 378 | 89.2 | -9999 | -9999 |
| 1977 | -9999 | 21.8 | -9999 | -9999 | 35.5 | 40.3 | 249 | 345 | 370 | 279 | 108 | 52.2 | -9999 |
| 1978 | 35.7 | 27.9 | 23.8 | 40.5 | 35.5 | 73.8 | 391 | 740 | 779 | 393 | -9999 | -9999 | -9999 |
| |
|
|
|
|
|
|
|
|
|
|
|
|
|
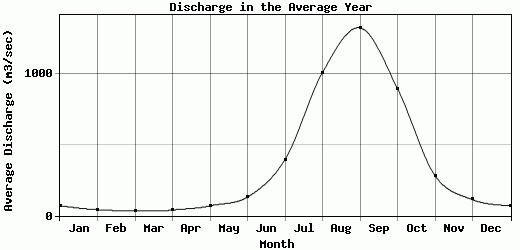
| Avg | 68.73 | 42.19 | 32.97 | 39.8 | 69.39 | 130.89 | 394.21 | 1007.14 | 1321.42 | 893.32 | 281.41 | 112.96 | 354.97 |
| |
|
|
|
|
|
|
|
|
|
|
|
|
|
| Std Dev | 27.79 |
18.38 |
13.13 |
14.42 |
29.17 |
59.17 |
142.26 |
360.13 |
346.59 |
361.89 |
182.02 |
57.04 |
84.23 |
| |
|
|
|
|
|
|
|
|
|
|
|
|
|
| | Jan | Feb | Mar | Apr | May | Jun | Jul | Aug | Sep | Oct | Nov | Dec | Avg Annual |
Click here for this table in tab-delimited format.
Tab-delimited format will open in most table browsing software, i.e. Excel, etc.
View this station on the map.
Return to start.