Results
| Country: | France
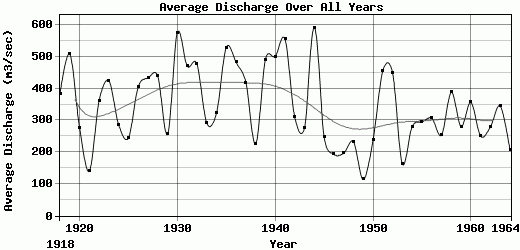
| | Station: | Gien | | River: | Loire | | Area: | 35890 km2 | | Lat: | 47.68 | | Lon: | 2.58 | | Source: | RivDIS | | PointID: | 738 | | Area Units: | km2 | | Discharge Units: | m3/sec | | Starting Year: | 1918 | | Ending Year: | 1964 | | Total Years: | 47 | | Total Usable Years: | 47 | |
| |
| Year | Jan | Feb | Mar | Apr | May | Jun | Jul | Aug | Sep | Oct | Nov | Dec | Avg Annual |
|---|
| 1918 | 847 | 273 | 183 | 764 | 689 | 183 | 93 | 32 | 61 | 122 | 240 | 1112 | 383.25 |
| 1919 | 1073 | 901 | 1066 | 1080 | 556 | 108 | 129 | 39 | 25 | 54 | 319 | 754 | 508.67 |
| 1920 | 673 | 272 | 441 | 478 | 179 | 93 | 164 | 57 | 79 | 452 | 208 | 225 | 276.75 |
| 1921 | 255 | 215 | 128 | 186 | 388 | 215 | 54 | 47 | 68 | 25 | 40 | 68 | 140.75 |
| 1922 | 359 | 573 | 488 | 1300 | 551 | 137 | 68 | 36 | 65 | 137 | 355 | 265 | 361.17 |
| 1923 | 551 | 689 | 1085 | 402 | 225 | 118 | 47 | 28 | 30 | 93 | 540 | 1275 | 423.58 |
| 1924 | 1205 | 275 | 338 | 405 | 158 | 57 | 30 | 43 | 32 | 272 | 172 | 445 | 286 |
| 1925 | 165 | 250 | 236 | 420 | 438 | 247 | 152 | 68 | 100 | 100 | 325 | 438 | 244.92 |
| 1926 | 690 | 725 | 385 | 430 | 960 | 658 | 136 | 57 | 32 | 32 | 315 | 450 | 405.83 |
| 1927 | 338 | 290 | 1255 | 630 | 255 | 122 | 315 | 445 | 420 | 230 | 391 | 510 | 433.42 |
| 1928 | 555 | 898 | 372 | 770 | 860 | 280 | 68 | 36 | 36 | 72 | 588 | 730 | 438.75 |
| 1929 | 388 | 284 | 276 | 176 | 284 | 320 | 144 | 93 | 40 | 122 | 315 | 638 | 256.67 |
| 1930 | 810 | 398 | 650 | 550 | 840 | 980 | 424 | 205 | 115 | 480 | 910 | 563 | 577.08 |
| 1931 | 798 | 800 | 1300 | 375 | 415 | 147 | 136 | 111 | 301 | 154 | 575 | 545 | 471.42 |
| 1932 | 580 | 200 | 315 | 1160 | 1010 | 575 | 420 | 154 | 122 | 305 | 315 | 570 | 477.17 |
| 1933 | 284 | 420 | 488 | 172 | 151 | 122 | 97 | 29 | 32 | 638 | 720 | 351 | 292 |
| 1934 | 590 | 305 | 790 | 545 | 450 | 104 | 57 | 43 | 29 | 43 | 348 | 568 | 322.67 |
| 1935 | 670 | 812 | 830 | 590 | 409 | 332 | 75 | 61 | 104 | 230 | 840 | 1400 | 529.42 |
| 1936 | 1205 | 995 | 495 | 650 | 545 | 505 | 320 | 350 | 122 | 136 | 250 | 222 | 482.92 |
| 1937 | 276 | 1080 | 1110 | 750 | 385 | 284 | 129 | 61 | 65 | 93 | 326 | 475 | 419.5 |
| 1938 | 409 | 552 | 250 | 118 | 118 | 165 | 154 | 79 | 176 | 194 | 186 | 309 | 225.83 |
| 1939 | 937 | 449 | 535 | 768 | 441 | 176 | 118 | 108 | 136 | 395 | 1181 | 657 | 491.75 |
| 1940 | 528 | 1217 | 398 | 628 | 926 | 431 | 179 | 36 | 72 | 467 | 481 | 651 | 501.17 |
| 1941 | 1260 | 1421 | 614 | 696 | 434 | 682 | 172 | 204 | 147 | 115 | 592 | 337 | 556.17 |
| 1942 | 495 | 667 | 1062 | 337 | 183 | 179 | 86 | 54 | 47 | 68 | 323 | 219 | 310 |
| 1943 | 728 | 409 | 194 | 147 | 136 | 86 | 57 | 43 | 75 | 406 | 452 | 596 | 277.42 |
| 1944 | 2080 | 456 | 406 | 466 | 165 | 83 | 133 | 83 | 194 | 517 | 1220 | 1295 | 591.5 |
| 1945 | 355 | 1515 | 268 | 154 | 93 | 101 | 39 | 25 | 47 | 43 | 93 | 240 | 247.75 |
| 1946 | 237 | 414 | 420 | 150 | 294 | 355 | 108 | 47 | 54 | 36 | 54 | 151 | 193.33 |
| 1947 | 298 | 266 | 689 | 477 | 165 | 100 | 54 | 36 | 25 | 25 | 61 | 165 | 196.75 |
| 1948 | 635 | 567 | 183 | 147 | 337 | 287 | 111 | 97 | 147 | 61 | 90 | 129 | 232.58 |
| 1949 | 248 | 122 | 168 | 86 | 86 | 125 | 32 | 15 | 22 | 25 | 151 | 291 | 114.25 |
| 1950 | 245 | 536 | 241 | 326 | 263 | 144 | 54 | 27 | 45 | 39 | 398 | 528 | 237.17 |
| 1951 | 535 | 621 | 771 | 436 | 591 | 738 | 308 | 164 | 98 | 88 | 743 | 374 | 455.58 |
| 1952 | 701 | 849 | 664 | 642 | 244 | 89 | 36 | 26 | 38 | 212 | 710 | 1188 | 449.92 |
| 1953 | 372 | 308 | 219 | 161 | 110 | 125 | 141 | 58 | 40 | 126 | 150 | 141 | 162.58 |
| 1954 | 247 | 402 | 577 | 509 | 282 | 158 | 77 | 128 | 208 | 135 | 164 | 480 | 280.58 |
| 1955 | 1099 | 1114 | 407 | 221 | 95 | 125 | 105 | 58 | 47 | 49 | 65 | 152 | 294.75 |
| 1956 | 314 | 255 | 413 | 397 | 239 | 347 | 220 | 127 | 428 | 343 | 319 | 277 | 306.58 |
| 1957 | 391 | 824 | 538 | 220 | 171 | 332 | 165 | 63 | 46 | 49 | 77 | 168 | 253.67 |
| 1958 | 499 | 537 | 576 | 553 | 370 | 209 | 203 | 109 | 103 | 267 | 511 | 722 | 388.25 |
| 1959 | 929 | 331 | 400 | 322 | 380 | 205 | 162 | 53 | 52 | 76 | 127 | 332 | 280.75 |
| 1960 | 521 | 518 | 681 | 252 | 115 | 67 | 69 | 133 | 197 | 573 | 701 | 451 | 356.5 |
| 1961 | 685 | 832 | 242 | 150 | 138 | 139 | 68 | 60 | 30 | 86 | 195 | 382 | 250.58 |
| 1962 | 595 | 398 | 505 | 730 | 392 | 161 | 67 | 37 | 32 | 35 | 118 | 282 | 279.33 |
| 1963 | 381 | 298 | 597 | 670 | 279 | 407 | 236 | 253 | 188 | 114 | 456 | 267 | 345.5 |
| 1964 | 150 | 215 | 525 | 615 | 326 | 232 | 60 | 38 | 40 | 73 | 90 | 122 | 207.17 |
| |
|
|
|
|
|
|
|
|
|
|
|
|
|
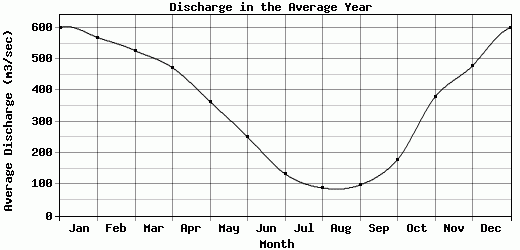
| Avg | 599.7 | 569.11 | 527.11 | 472.57 | 364.28 | 251.81 | 133.45 | 88.43 | 98.13 | 178.87 | 378.72 | 478.94 | 345.09 |
| |
|
|
|
|
|
|
|
|
|
|
|
|
|
| Std Dev | 360.22 |
330.48 |
294.83 |
276.93 |
241.29 |
198.1 |
93.77 |
83.99 |
91.75 |
163.3 |
282.53 |
322.75 |
120.85 |
| |
|
|
|
|
|
|
|
|
|
|
|
|
|
| | Jan | Feb | Mar | Apr | May | Jun | Jul | Aug | Sep | Oct | Nov | Dec | Avg Annual |
Click here for this table in tab-delimited format.
Tab-delimited format will open in most table browsing software, i.e. Excel, etc.
View this station on the map.
Return to start.