Results
| Country: | U.S.A.
| | Station: | Waterville,Ohio | | River: | Maumec | | Area: | 16395 km2 | | Lat: | 41.5 | | Lon: | -83.71 | | Source: | RivDIS | | PointID: | 401 | | Area Units: | km2 | | Discharge Units: | m3/sec | | Starting Year: | 1965 | | Ending Year: | 1984 | | Total Years: | 20 | | Total Usable Years: | 20 | |
| |
| Year | Jan | Feb | Mar | Apr | May | Jun | Jul | Aug | Sep | Oct | Nov | Dec | Avg Annual |
|---|
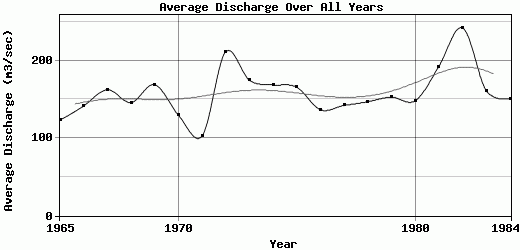
| 1965 | 87 | 210 | 374 | 377 | 100 | 21 | 12 | 10 | 22 | 70 | 35 | 161 | 123.25 |
| 1966 | 147 | 102 | 137 | 96 | 242 | 33 | 76 | 16 | 8 | 7 | 155 | 675 | 141.17 |
| 1967 | 72 | 260 | 454 | 247 | 222 | 32 | 19 | 15 | 7 | 21 | 68 | 529 | 162.17 |
| 1968 | 151 | 382 | 196 | 176 | 261 | 185 | 78 | 61 | 18.5 | 11 | 52 | 178 | 145.79 |
| 1969 | 516 | 330 | 103 | 303 | 219 | 123 | 105 | 16 | 20.5 | 36.5 | 194 | 59 | 168.75 |
| 1970 | 42 | 251 | 261 | 409 | 243 | 60 | 66.5 | 23.5 | 14.5 | 24.5 | 48 | 112 | 129.58 |
| 1971 | 34 | 391 | 248 | 53 | 179 | 94.5 | 28 | 9.6 | 18 | 20 | 10 | 144 | 102.43 |
| 1972 | 148 | 32 | 273 | 511 | 129 | 71 | 99.5 | 30 | 234 | 155 | 518 | 334 | 211.21 |
| 1973 | 218 | 146 | 576 | 249 | 143 | 301 | 141 | 58.5 | 10 | 12 | 40 | 200 | 174.54 |
| 1974 | 557 | 305 | 411 | 276 | 207 | 59.3 | 15.5 | 13 | 13.5 | 7.53 | 21.5 | 135 | 168.44 |
| 1975 | 266 | 382 | 225 | 175 | 201 | 207 | 60 | 64.5 | 85.5 | 42 | 43.5 | 235 | 165.54 |
| 1976 | 137 | 840 | 359 | 85 | 75 | 50 | 30 | 15 | 8.1 | 14 | 9.9 | 14 | 136.42 |
| 1977 | 8.9 | 44 | 389 | 333 | 134 | 18 | 55 | 39 | 85 | 33 | 38 | 528 | 142.08 |
| 1978 | 50 | 24 | 811 | 533 | 110 | 60 | 85 | 15 | 9.8 | 7.3 | 14 | 43 | 146.84 |
| 1979 | 75 | 65 | 430 | 359 | 142 | 60 | 85 | 137 | 44 | 13 | 142 | 280 | 152.67 |
| 1980 | 115 | 92 | 499 | 341 | 116 | 280 | 105 | 98 | 42 | 14 | 15.5 | 59 | 148.04 |
| 1981 | 35 | 433 | 92 | 228 | 263 | 680 | 76.5 | 38.5 | 141 | 117 | 80 | 123 | 192.25 |
| 1982 | 236 | 360 | 1081 | 311 | 142 | 132 | 101 | 11.5 | 9 | 8.6 | 148 | 364 | 242.01 |
| 1983 | 84 | 121 | 126 | 413 | 358 | 81 | 81 | 14 | 6.7 | 31.5 | 238 | 378 | 161.02 |
| 1984 | 28.5 | 315 | 424 | 505 | 202 | 63.5 | 20.5 | 22 | 12.5 | 29.5 | 70.5 | 114 | 150.58 |
| |
|
|
|
|
|
|
|
|
|
|
|
|
|
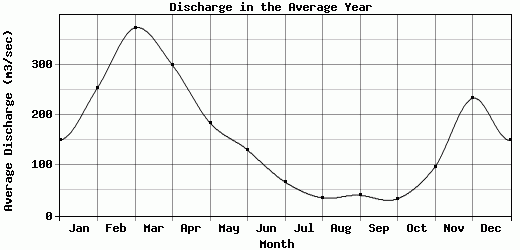
| Avg | 150.37 | 254.25 | 373.45 | 299 | 184.4 | 130.57 | 66.97 | 35.36 | 40.48 | 33.72 | 97.05 | 233.25 | 158.24 |
| |
|
|
|
|
|
|
|
|
|
|
|
|
|
| Std Dev | 146.55 |
188.81 |
237.11 |
135.79 |
68.15 |
149.05 |
35.31 |
32.78 |
56 |
37.7 |
115.89 |
177.9 |
30.17 |
| |
|
|
|
|
|
|
|
|
|
|
|
|
|
| | Jan | Feb | Mar | Apr | May | Jun | Jul | Aug | Sep | Oct | Nov | Dec | Avg Annual |
Click here for this table in tab-delimited format.
Tab-delimited format will open in most table browsing software, i.e. Excel, etc.
View this station on the map.
Return to start.