Results
| Country: | U.S.S.R.
| | Station: | Chabda | | River: | Maya | | Area: | 165000 km2 | | Lat: | 59.77 | | Lon: | 134.75 | | Source: | RivDIS | | PointID: | 1251 | | Area Units: | km2 | | Discharge Units: | m3/sec | | Starting Year: | 1965 | | Ending Year: | 1984 | | Total Years: | 20 | | Total Usable Years: | 20 | |
| |
| Year | Jan | Feb | Mar | Apr | May | Jun | Jul | Aug | Sep | Oct | Nov | Dec | Avg Annual |
|---|
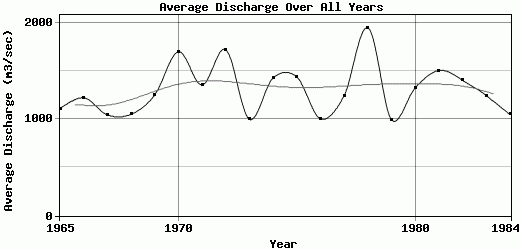
| 1965 | 63 | 44 | 38 | 39 | 2570 | 3630 | 2990 | 1270 | 1590 | 697 | 228 | 138 | 1108.08 |
| 1966 | 87 | 61 | 56 | 54 | 3600 | 4820 | 1220 | 2100 | 1800 | 469 | 234 | 163 | 1222 |
| 1967 | 88 | 66 | 57 | 104 | 4190 | 3180 | 1390 | 1870 | 756 | 510 | 205 | 115 | 1044.25 |
| 1968 | 66 | 39 | 41 | 601 | 2740 | 5160 | 1310 | 988 | 780 | 572 | 197 | 110 | 1050.33 |
| 1969 | 56.5 | 43.5 | 28.5 | 29.5 | 2290 | 5570 | 3250 | 1110 | 1580 | 656 | 217 | 154 | 1248.75 |
| 1970 | 82 | 54.5 | 43.5 | 47.5 | 5930 | 8110 | 2160 | 1230 | 1420 | 814 | 295 | 191 | 1698.13 |
| 1971 | 8.5 | 59 | 52.5 | 50 | 4520 | 4270 | 1920 | 2320 | 2280 | 475 | 179 | 113 | 1353.92 |
| 1972 | 78.5 | 34.5 | 34 | 213 | 3750 | 3600 | 3220 | 4460 | 3170 | 1510 | 372 | 197 | 1719.92 |
| 1973 | 126 | 77 | 67 | 67.5 | 2530 | 2830 | 1980 | 2150 | 1190 | 564 | 234 | 158 | 997.79 |
| 1974 | 87.5 | 60.5 | 52 | 52.5 | 5860 | 3510 | 1870 | 2410 | 1910 | 921 | 215 | 158 | 1425.54 |
| 1975 | 100 | 63 | 52.5 | 182 | 3000 | 2600 | 1470 | 4380 | 3690 | 1100 | 375 | 236 | 1437.38 |
| 1976 | 129 | 69 | 56.5 | 66 | 3500 | 3810 | 1490 | 910 | 1280 | 335 | 243 | 157 | 1003.79 |
| 1977 | 87.5 | 5 | 52.5 | 59 | 4280 | 2870 | 1480 | 2230 | 2460 | 828 | 339 | 225 | 1243 |
| 1978 | 142 | 91 | 75.5 | 115 | 4160 | 7510 | 4120 | 2970 | 2310 | 1170 | 422 | 263 | 1945.71 |
| 1979 | 125 | 85.5 | 60 | 72.5 | 3360 | 2050 | 1340 | 2580 | 1410 | 368 | 282 | 182 | 992.92 |
| 1980 | 136 | 105 | 72.5 | 72 | 3040 | 6500 | 2020 | 1400 | 1350 | 733 | 272 | 189 | 1324.13 |
| 1981 | 123 | 92 | 74 | 76.5 | 4690 | 3800 | 2480 | 2940 | 2340 | 897 | 343 | 197 | 1504.38 |
| 1982 | 126 | 87 | 73.5 | 116 | 2980 | 3740 | 3260 | 1590 | 3090 | 1140 | 399 | 225 | 1402.21 |
| 1983 | 136 | 92 | 73 | 82.5 | 4630 | 3380 | 1130 | 2030 | 1700 | 1080 | 394 | 198 | 1243.79 |
| 1984 | 118 | 80.5 | 66.5 | 74.5 | 3790 | 3400 | 1410 | 1790 | 1010 | 416 | 277 | 145 | 1048.13 |
| |
|
|
|
|
|
|
|
|
|
|
|
|
|
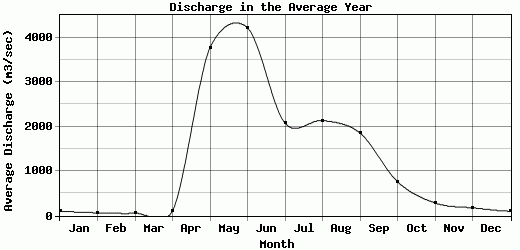
| Avg | 98.28 | 65.45 | 56.3 | 108.7 | 3770.5 | 4217 | 2075.5 | 2136.4 | 1855.8 | 762.75 | 286.1 | 175.7 | 1300.71 |
| |
|
|
|
|
|
|
|
|
|
|
|
|
|
| Std Dev | 33.29 |
23.8 |
13.81 |
121.4 |
1000.51 |
1574.52 |
839.28 |
963.87 |
783.55 |
309.47 |
74.51 |
41.16 |
260.64 |
| |
|
|
|
|
|
|
|
|
|
|
|
|
|
| | Jan | Feb | Mar | Apr | May | Jun | Jul | Aug | Sep | Oct | Nov | Dec | Avg Annual |
Click here for this table in tab-delimited format.
Tab-delimited format will open in most table browsing software, i.e. Excel, etc.
View this station on the map.
Return to start.