Results
| Country: | Cameroon
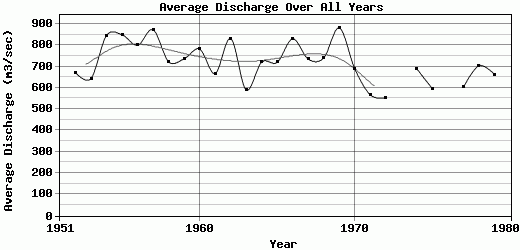
| | Station: | Goura | | River: | Mbam | | Area: | 42300 km2 | | Lat: | 4.56 | | Lon: | 11.36 | | Source: | RivDIS | | PointID: | 28 | | Area Units: | km2 | | Discharge Units: | m3/sec | | Starting Year: | 1951 | | Ending Year: | 1980 | | Total Years: | 30 | | Total Usable Years: | 28 | |
| |
| Year | Jan | Feb | Mar | Apr | May | Jun | Jul | Aug | Sep | Oct | Nov | Dec | Avg Annual |
|---|
| 1951 | -9999 | -9999 | -9999 | 150 | 470 | 580 | 996 | 1070 | 1600 | 2160 | 1350 | 469 | -9999 |
| 1952 | 236 | 135 | 89 | 182 | 326 | 468 | 732 | 1130 | 1550 | 1840 | 1030 | 343 | 671.75 |
| 1953 | 126 | 118 | 194 | 156 | 229 | 432 | 818 | 839 | 1650 | 1830 | 953 | 375 | 643.33 |
| 1954 | 228 | 172 | 163 | 242 | 387 | 814 | 1100 | 895 | 2100 | 2320 | 1250 | 472 | 845.25 |
| 1955 | 241 | 177 | 220 | 211 | 474 | 801 | 1080 | 1390 | 1740 | 2110 | 1250 | 490 | 848.67 |
| 1956 | 277 | 217 | 333 | 521 | 449 | 818 | 987 | 987 | 1550 | 1780 | 1220 | 456 | 799.58 |
| 1957 | 267 | 141 | 101 | 208 | 432 | 799 | 1140 | 1290 | 1680 | 2180 | 1480 | 748 | 872.17 |
| 1958 | 317 | 163 | 123 | 231 | 565 | 729 | 801 | 1000 | 1480 | 1420 | 1220 | 617 | 722.17 |
| 1959 | 264 | 124 | 94.9 | 177 | 337 | 491 | 760 | 984 | 1490 | 2270 | 1350 | 484 | 735.49 |
| 1960 | 236 | 118 | 86.4 | 197 | 258 | 530 | 952 | 1380 | 1650 | 2120 | 1330 | 521 | 781.53 |
| 1961 | 275 | 141 | 68.6 | 144 | 183 | 313 | 905 | 832 | 1490 | 2230 | 1040 | 377 | 666.55 |
| 1962 | 168 | 96.7 | 121 | 221 | 329 | 472 | 1040 | 1100 | 1880 | 2170 | 1600 | 772 | 830.81 |
| 1963 | 326 | 186 | 151 | 226 | 415 | 259 | 544 | 871 | 1300 | 1640 | 849 | 317 | 590.33 |
| 1964 | 166 | 91.9 | 85.5 | 240 | 331 | 461 | 898 | 778 | 1420 | 2360 | 1340 | 472 | 720.28 |
| 1965 | 247 | 143 | 134 | 203 | 400 | 492 | 835 | 1290 | 1540 | 1920 | 1040 | 389 | 719.42 |
| 1966 | 172 | 94.5 | 70.6 | 224 | 638 | 1030 | 1070 | 1450 | 1600 | 1870 | 1290 | 443 | 829.34 |
| 1967 | 202 | 111 | 69.5 | 83.3 | 143 | 240 | 717 | 1270 | 1690 | 2570 | 1250 | 463 | 734.07 |
| 1968 | 230 | 105 | 129 | 148 | 260 | 498 | 900 | 1240 | 1830 | 1800 | 1270 | 468 | 739.83 |
| 1969 | 212 | 116 | 263 | 294 | 415 | 610 | 1200 | 1480 | 1840 | 1990 | 1590 | 564 | 881.17 |
| 1970 | 273 | 138 | 101 | 174 | 341 | 544 | 705 | 1132 | 1379 | 1852 | 1242 | 384 | 688.75 |
| 1971 | 187 | 80 | 104 | 142 | 133 | 317 | 844 | 1089 | 1477 | 1531 | 587 | 313 | 567 |
| 1972 | 114 | 57 | 65.5 | 136 | 178 | 427 | 844 | 867 | 1298 | 1692 | 684 | 257 | 551.63 |
| 1973 | 119 | 49 | 34 | -9999 | 292 | 407 | 524 | 915 | 1406 | 1449 | 756 | 293 | -9999 |
| 1974 | 114 | 54 | 47 | 169 | 216 | 553 | 756 | 1042 | 1704 | 1946 | 1239 | 421 | 688.42 |
| 1975 | 266 | 202 | 156 | 217 | 226 | 533 | 548 | 631 | 1101 | 1864 | 954 | 454 | 596 |
| 1976 | 239 | 164 | 129 | 197 | 395 | -9999 | 776 | 1175 | 1451 | 1855 | -9999 | 449 | -9999 |
| 1977 | 306 | 279 | 199 | 233 | 273 | 287 | 783 | 974 | 1578 | 1550 | 504 | 264 | 602.5 |
| 1978 | 222 | 166 | 139 | 200 | 269 | 414 | 633 | 866 | 1805 | 1985 | 1362 | 384 | 703.75 |
| 1979 | 262 | 210 | 203 | 254 | 439 | 540 | 879 | 1158 | 1276 | 1306 | 1075 | 349 | 662.58 |
| 1980 | 223 | 186 | 171 | -9999 | -9999 | -9999 | -9999 | -9999 | -9999 | -9999 | -9999 | -9999 | -9999 |
| |
|
|
|
|
|
|
|
|
|
|
|
|
|
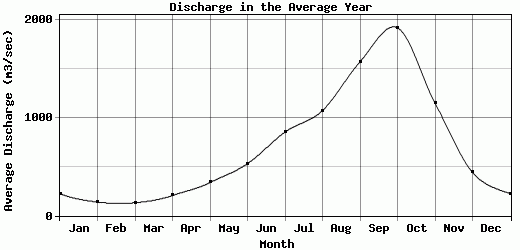
| Avg | 224.66 | 139.14 | 132.59 | 206.44 | 338.03 | 530.68 | 854.03 | 1073.28 | 1570.86 | 1917.59 | 1146.61 | 441.66 | 718.94 |
| |
|
|
|
|
|
|
|
|
|
|
|
|
|
| Std Dev | 58.03 |
52.1 |
65.78 |
74.42 |
120.78 |
187.32 |
174.85 |
211.57 |
207.22 |
299.34 |
274.32 |
120.33 |
94.24 |
| |
|
|
|
|
|
|
|
|
|
|
|
|
|
| | Jan | Feb | Mar | Apr | May | Jun | Jul | Aug | Sep | Oct | Nov | Dec | Avg Annual |
Click here for this table in tab-delimited format.
Tab-delimited format will open in most table browsing software, i.e. Excel, etc.
View this station on the map.
Return to start.