Results
| Country: | U.S.A.
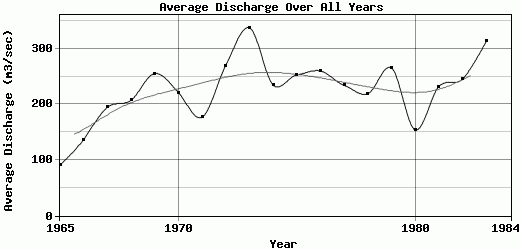
| | Station: | Lowell,Massachussets | | River: | Merrimack | | Area: | 12005 km2 | | Lat: | 42.65 | | Lon: | -71.3 | | Source: | RivDIS | | PointID: | 416 | | Area Units: | km2 | | Discharge Units: | m3/sec | | Starting Year: | 1965 | | Ending Year: | 1984 | | Total Years: | 20 | | Total Usable Years: | 19 | |
| |
| Year | Jan | Feb | Mar | Apr | May | Jun | Jul | Aug | Sep | Oct | Nov | Dec | Avg Annual |
|---|
| 1965 | 72 | 93 | 166 | 249 | 141 | 64 | 33 | 25 | 39 | 61 | 75 | 71 | 90.75 |
| 1966 | 73 | 118 | 312 | 264 | 232 | 107 | 34 | 39 | 54 | 87 | 190 | 131 | 136.75 |
| 1967 | 113 | 108 | 152 | 663 | 452 | 209 | 124 | 85 | 49 | 83 | 107 | 193 | 194.83 |
| 1968 | 126 | 139 | 486 | 399 | 288 | 328 | 168 | 52 | 46.5 | 54 | 127 | 275 | 207.38 |
| 1969 | 147 | 157 | 301 | 925 | 390 | 136 | 70 | 162 | 75.5 | 57.5 | 315 | 331 | 255.58 |
| 1970 | 263 | 515 | 281 | 663 | 330 | 107 | 63 | 44 | 47.5 | 87 | 119 | 139 | 221.54 |
| 1971 | 116 | 146 | 275 | 607 | 462 | 98.5 | 44 | 59 | 58 | 60 | 64 | 134 | 176.96 |
| 1972 | 144 | 168 | 429 | 633 | 537 | 285 | 192 | 82.5 | 61.5 | 85.5 | 272 | 351 | 270.04 |
| 1973 | 371 | 456 | 565 | 632 | 469 | 238 | 411 | 116 | 60.5 | 72.5 | 127 | 535 | 337.75 |
| 1974 | 362 | 306 | 363 | 521 | 397 | 160 | 72 | 39.5 | 87 | 106 | 155 | 252 | 235.04 |
| 1975 | 232 | 225 | 404 | 519 | 230 | 161 | 98 | 55 | 124 | 319 | 382 | 286 | 252.92 |
| 1976 | 247 | 445 | 503 | 504 | 346 | 95 | 70 | 283 | 138 | 263 | 125 | 103 | 260.17 |
| 1977 | 75 | 85 | 606 | 585 | 225 | 105 | 55 | 47 | 75 | 357 | 249 | 348 | 234.33 |
| 1978 | 519 | 356 | 271 | 601 | 367 | 205 | 55 | 48 | 35 | 47 | 55 | 70 | 219.08 |
| 1979 | 278 | 184 | 700 | 514 | 404 | 189 | 60 | 75 | 95 | 245 | 228 | 214 | 265.5 |
| 1980 | 148 | 68.5 | 292 | 533 | 263 | 101 | 63.5 | 38.5 | 33 | 74 | 101 | 135 | 154.21 |
| 1981 | 66.5 | 415 | 364 | 313 | 271 | 125 | 144 | 132 | 112 | 246 | 318 | 280 | 232.21 |
| 1982 | 290 | 279 | 338 | 701 | 272 | 431 | 144 | 102 | 50.5 | 83.5 | 131 | 126 | 245.67 |
| 1983 | 228 | 292 | 785 | 676 | 480 | 262 | 61 | 42 | 37.5 | 63 | 283 | 553 | 313.54 |
| 1984 | 220 | 481 | 424 | 782 | 460 | 670 | 215 | 62.5 | 48.5 | -9999 | -9999 | -9999 | -9999 |
| |
|
|
|
|
|
|
|
|
|
|
|
|
|
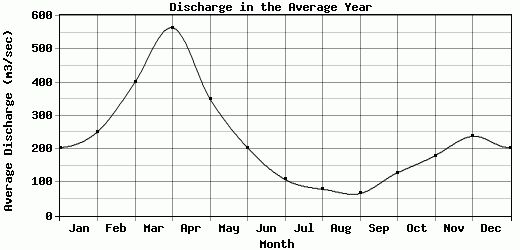
| Avg | 204.53 | 251.83 | 400.85 | 564.2 | 350.8 | 203.83 | 108.83 | 79.45 | 66.35 | 129 | 180.16 | 238.26 | 226.54 |
| |
|
|
|
|
|
|
|
|
|
|
|
|
|
| Std Dev | 117.07 |
143.89 |
162.13 |
163.12 |
104.85 |
139.98 |
86.71 |
58.11 |
29.6 |
97.53 |
94.97 |
137.41 |
57.21 |
| |
|
|
|
|
|
|
|
|
|
|
|
|
|
| | Jan | Feb | Mar | Apr | May | Jun | Jul | Aug | Sep | Oct | Nov | Dec | Avg Annual |
Click here for this table in tab-delimited format.
Tab-delimited format will open in most table browsing software, i.e. Excel, etc.
View this station on the map.
Return to start.