Results
| Country: | Sudan
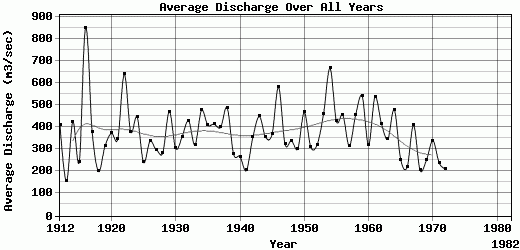
| | Station: | Kilo3 | | River: | Atbara | | Area: | 69000 km2 | | Lat: | 17.7 | | Lon: | 33.97 | | Source: | RivDIS | | PointID: | 1522 | | Area Units: | km2 | | Discharge Units: | m3/sec | | Starting Year: | 1912 | | Ending Year: | 1982 | | Total Years: | 71 | | Total Usable Years: | 66 | |
| |
| Year | Jan | Feb | Mar | Apr | May | Jun | Jul | Aug | Sep | Oct | Nov | Dec | Avg Annual |
|---|
| 1912 | 11.2 | 2 | 0 | 0 | 0 | 48.6 | 742 | 2609 | 1284 | 151 | 52.5 | 17.2 | 409.79 |
| 1913 | 12.7 | 1.24 | 0 | 0 | 0 | 0 | 221 | 877 | 652 | 78.4 | 12.3 | 1.87 | 154.71 |
| 1914 | 0 | 0 | 0 | 0 | 0 | 3.86 | 586 | 2680 | 1265 | 384 | 127 | 30.6 | 423.04 |
| 1915 | 9.33 | 1.24 | 0 | 0 | 0 | 52.5 | 320 | 1142 | 1060 | 255 | 56.3 | 13.1 | 242.46 |
| 1916 | 1.87 | 0 | 0 | 0 | 0 | 30.5 | 1926 | 4928 | 2484 | 574 | 175 | 64.5 | 848.66 |
| 1917 | 25.4 | 4.13 | 0 | 0 | 0 | 85.3 | 462 | 533 | 2858 | 451 | 104 | 35.5 | 379.86 |
| 1918 | 13.1 | 3.72 | 0 | 0 | 1.12 | 8.49 | 392 | 1351 | 462 | 145 | 25.8 | 2.99 | 200.44 |
| 1919 | 0 | 0 | 0 | 0 | 0 | 38.6 | 668 | 1736 | 1122 | 170 | 30.5 | 0.74 | 313.82 |
| 1920 | 0 | 0 | 0 | 0 | 0 | 84.5 | 694 | 2255 | 1003 | 344 | 77.2 | 16.1 | 372.82 |
| 1921 | 0 | 0 | 0 | 0 | 0 | 19.3 | 429 | 2060 | 1323 | 289 | 56.7 | 4.48 | 348.46 |
| 1922 | 0 | 0 | 0 | 0 | 0 | 16.6 | 742 | 2949 | 2881 | 373 | 65.2 | 635 | 638.48 |
| 1923 | 0 | 0 | 0 | 0 | 0 | 27.8 | 477 | 2277 | 1419 | 270 | 53.6 | 16.18 | 378.38 |
| 1924 | 4.48 | 0 | 0 | 0 | 0 | 24.7 | 925 | 2270 | 1720 | 288 | 99.9 | 21.7 | 446.15 |
| 1925 | 0 | 0 | 0 | 0 | 0 | 18.5 | 418 | 1474 | 779 | 173 | 28.5 | 0 | 240.92 |
| 1926 | 0 | 0 | 0 | 0 | 0 | 0 | 754 | 1709 | 1288 | 232 | 54.8 | 0 | 336.48 |
| 1927 | 0 | 0 | 0 | 0 | 0 | 21.2 | 601 | 1624 | 1060 | 229 | 28.9 | 0 | 297.01 |
| 1928 | 0 | 0 | 0 | 0 | 0 | 66.7 | 485 | 1743 | 906 | 177 | 40.5 | 0 | 284.85 |
| 1929 | 0 | 0 | 0 | 0 | 0 | 91 | 963 | 2703 | 1450 | 363 | 63.7 | 13.4 | 470.59 |
| 1930 | 0 | 0 | 0 | 0 | 0 | 15.8 | 884 | 1556 | 968 | 167 | 42.4 | 7.09 | 303.36 |
| 1931 | 0 | 0 | 3.36 | 0 | 0 | 8.49 | 395 | 2060 | 1369 | 347 | 71.8 | 20.2 | 356.24 |
| 1932 | 0 | 0 | 0 | 0 | 0 | 2.7 | 720 | 2362 | 1682 | 303 | 55.9 | 18.3 | 428.66 |
| 1933 | 0 | 0 | 0 | 0 | 0 | 0 | 326 | 1359 | 1616 | 371 | 111 | 44.4 | 318.95 |
| 1934 | 2.99 | 0 | 0 | 0 | 0 | 128 | 1056 | 2770 | 1273 | 388 | 66 | 24.6 | 475.72 |
| 1935 | 0 | 0 | 0 | 0 | 2.24 | 89.5 | 545 | 1881 | 1871 | 421 | 74.1 | 24.6 | 409.04 |
| 1936 | 0 | 0 | 0 | 0 | 0 | 0 | 649 | 2083 | 1832 | 302 | 67.9 | 23.9 | 413.15 |
| 1937 | 0 | 0 | 0 | 0 | 0 | 3.47 | 582 | 2389 | 1458 | 291 | 59.4 | 17.5 | 400.03 |
| 1938 | 0 | 0 | 0 | 0 | 0 | 0 | 593 | 2747 | 1859 | 515 | 100 | 34.7 | 487.39 |
| 1939 | 0 | 0 | 0 | 0 | 0 | 5.02 | 474 | 1482 | 995 | 306 | 73.3 | 14.6 | 279.16 |
| 1940 | 0 | 0 | 0 | 0 | 0 | 0 | 399 | 1754 | 860 | 145 | 30.1 | 10.5 | 266.55 |
| 1941 | 0 | 0 | 0 | 0 | 0 | 14.3 | 294 | 1153 | 659 | 209 | 105 | 22.4 | 204.73 |
| 1942 | 0 | 0 | 0 | 0 | 0 | 0 | 597 | 2023 | 1242 | 301 | 57.9 | 22 | 353.58 |
| 1943 | 0 | 0 | 0 | 0 | 0 | 0 | 474 | 2243 | 2175 | 372 | 90.3 | 25.8 | 448.34 |
| 1944 | 9.33 | 3.19 | 0 | 0 | 0 | 0 | 881 | 2012 | 1049 | 221 | 47.5 | 18.7 | 353.48 |
| 1945 | 6.35 | 0 | 0 | 0 | 45.9 | 113 | 451 | 1683 | 1469 | 518 | 111 | 30.6 | 368.99 |
| 1946 | 5.97 | 0 | 0 | 0 | 0 | 121 | 910 | 3987 | 1446 | 336 | 113 | 38.1 | 579.76 |
| 1947 | 13.8 | 7.03 | 0.37 | 0 | 0 | 13.1 | 333 | 1844 | 1292 | 308 | 55.9 | 26.1 | 324.44 |
| 1948 | 14.6 | 5.19 | 0 | 0 | 0 | 89.1 | 616 | 1709 | 1153 | 369 | 73.7 | 33.2 | 338.57 |
| 1949 | 18.7 | 5.37 | 0 | 0 | 0 | 35.5 | 406 | 1534 | 1226 | 311 | 70.6 | 30.2 | 303.11 |
| 1950 | 22 | 0 | 0 | 0 | 0 | 0 | 813 | 2445 | 1902 | 310 | 70.2 | 34.3 | 466.38 |
| 1951 | 20.2 | 0.82 | 0 | 0 | 0 | 12 | 403 | 1706 | 1103 | 319 | 121 | 42.9 | 310.66 |
| 1952 | 17.2 | 0 | 0 | 0 | 0 | 0 | 418 | 1848 | 1257 | 237 | 52.9 | 16.4 | 320.54 |
| 1953 | 6.72 | 0.41 | 0 | 0 | 0 | 81.8 | 769 | 2744 | 1431 | 354 | 83.3 | 41.8 | 459.34 |
| 1954 | 23.1 | 7.85 | 0.74 | 0 | 0 | 66 | 862 | 3367 | 2654 | 798 | 148 | 60.9 | 665.63 |
| 1955 | 0 | 0 | 0 | 0 | 0 | 0 | 384 | 1960 | 1932 | 694 | 114 | 28.4 | 426.03 |
| 1956 | 0 | 0 | 0 | 0 | 0 | 0 | 724 | 2247 | 1462 | 724 | 234 | 59 | 454.17 |
| 1957 | 41.8 | 25.2 | 10.8 | 10.8 | 6.17 | 3.36 | 27.8 | 288 | 1967 | 1211 | 153 | 41.7 | 315.55 |
| 1958 | 21.3 | 15.3 | 1.87 | 0 | 0 | 37.4 | 574 | 2747 | 1550 | 414 | 79.9 | 30.2 | 455.91 |
| 1959 | 16.1 | 5.79 | 0.74 | 0 | 0 | 0 | 649 | 3076 | 2145 | 410 | 130 | 48.2 | 540.07 |
| 1960 | 22 | 9.18 | 1.87 | 0 | 0 | 3.09 | 563 | 1568 | 1284 | 300 | 65.6 | 20.5 | 319.77 |
| 1961 | 8.21 | 1.65 | 0 | 0 | 0 | 18.1 | 1657 | 2288 | 1863 | 448 | 97.6 | 57.9 | 536.62 |
| 1962 | 25 | 10.3 | 2.24 | 0 | 0 | 0 | 440 | 2258 | 1732 | 373 | 88.7 | 59 | 415.69 |
| 1963 | 16.4 | 7.44 | 0 | 0 | 5.6 | 6.56 | 541 | 1885 | 1292 | 303 | 57.5 | 38.5 | 346.08 |
| 1964 | 13.8 | 9.18 | 2.61 | 0 | 0 | 0 | 761 | 2699 | 1836 | 342 | 73.7 | 6.72 | 478.67 |
| 1965 | 61.6 | 55.8 | 0 | 0 | 5.6 | 15.4 | 418 | 1478 | 871 | 120 | 13.5 | 0 | 253.24 |
| 1966 | 2.24 | 0 | 0 | 48.6 | 43.7 | 160 | 258 | 1303 | 702 | 81 | 16.2 | 11.6 | 218.86 |
| 1967 | 2.99 | 1.24 | 1.12 | 30.1 | 70.9 | 42.8 | 589 | 2225 | 1543 | 348 | 34.7 | 5.23 | 407.84 |
| 1968 | 0 | 0 | 0 | 0 | 0 | 0 | 623 | 1448 | 262 | 138 | 3.86 | 1.12 | 206.33 |
| 1969 | 0 | 0 | 0 | 0 | 0 | 0 | 466 | 1945 | 555 | 29.9 | 3.86 | 1.49 | 250.1 |
| 1970 | 0 | 0 | 0 | 0 | 0 | 0 | 399 | 2359 | 1153 | 115 | 27 | 11.6 | 338.72 |
| 1971 | 0 | 0 | 0 | 0 | 0 | 0 | 440 | 1377 | 914 | 104 | 11.6 | 0 | 237.22 |
| 1972 | 0 | 0 | 0 | 0 | 0 | 0 | 937 | 1306 | 227 | 56 | 0 | 0 | 210.5 |
| 1973 | -9999 | -9999 | -9999 | -9999 | -9999 | -9999 | 698 | 2270 | 594 | 147 | 15.8 | 0 | -9999 |
| 1974 | -9999 | -9999 | -9999 | -9999 | -9999 | -9999 | 440 | 1702 | 1111 | 278 | 18.9 | 2.61 | -9999 |
| 1975 | -9999 | -9999 | -9999 | -9999 | -9999 | -9999 | 507 | 2535 | 1921 | 359 | 32.8 | 6.16 | -9999 |
| 1976 | -9999 | -9999 | -9999 | -9999 | -9999 | -9999 | 843 | 1676 | 644 | 75 | 5.79 | 0 | -9999 |
| 1977 | -9999 | -9999 | -9999 | -9999 | -9999 | -9999 | 1097 | 2251 | 655 | 149 | 50.9 | 31.9 | -9999 |
| 1978 | -9999 | -9999 | -9999 | -9999 | -9999 | -9999 | 418 | 1347 | 594 | 291 | 17 | 0 | -9999 |
| 1979 | -9999 | -9999 | -9999 | -9999 | -9999 | -9999 | 212 | 963 | 356 | 106 | 0.77 | 0 | -9999 |
| 1980 | -9999 | -9999 | -9999 | -9999 | -9999 | -9999 | 290 | 1877 | 1033 | 113 | 17.9 | 0 | -9999 |
| 1981 | -9999 | -9999 | -9999 | -9999 | -9999 | -9999 | 326 | 1183 | 1072 | 239 | 2.31 | 0 | -9999 |
| 1982 | -9999 | -9999 | -9999 | -9999 | -9999 | -9999 | 151 | 589 | 288 | 154 | 10.2 | 0 | -9999 |
| |
|
|
|
|
|
|
|
|
|
|
|
|
|
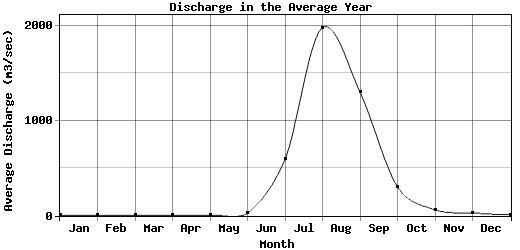
| Avg | 7.71 | 3 | 0.42 | 1.47 | 2.97 | 28.26 | 592.79 | 1979.03 | 1301.62 | 304.05 | 63.12 | 28.44 | 374.33 |
| |
|
|
|
|
|
|
|
|
|
|
|
|
|
| Std Dev | 11.58 |
8.11 |
1.51 |
7.3 |
11.88 |
38.68 |
299.72 |
740.46 |
578.88 |
185.74 |
44.83 |
74.63 |
122.7 |
| |
|
|
|
|
|
|
|
|
|
|
|
|
|
| | Jan | Feb | Mar | Apr | May | Jun | Jul | Aug | Sep | Oct | Nov | Dec | Avg Annual |
Click here for this table in tab-delimited format.
Tab-delimited format will open in most table browsing software, i.e. Excel, etc.
View this station on the map.
Return to start.