Results
| Country: | U.S.A.
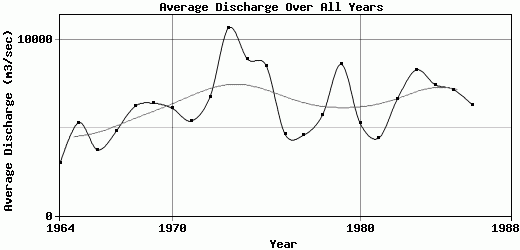
| | Station: | BRAINERD, MN | | River: | MISSISSIPPI RIVER | | Area: | 18957.68 | | Lat: | 46.37 | | Lon: | -94.18 | | Source: | USGS | | PointID: | 5242300 | | Area Units: | km2 | | Discharge Units: | m3/sec | | Starting Year: | 1964 | | Ending Year: | 1988 | | Total Years: | 25 | | Total Usable Years: | 23 | |
| |
| Year | Jan | Feb | Mar | Apr | May | Jun | Jul | Aug | Sep | Oct | Nov | Dec | Avg Annual |
|---|
| 1964 | 1506.28 | 2245.83 | 7061.89 | 9344.61 | 3468.38 | 932.57 | 1116.24 | 1183.83 | 1293.14 | 1827.82 | 1409.24 | 4299.62 | 2974.12 |
| 1965 | 5151.87 | 6762.71 | 8516.11 | 11160.7 | 8702.46 | 5168.8 | 3572.51 | 2288.2 | 3162.07 | 4462.21 | 2354.09 | 2341.18 | 5303.58 |
| 1966 | 4110.53 | 3887.52 | 3829.19 | 4495.8 | 10291.9 | 5657.74 | 2416.99 | 1957.53 | 1635.78 | 1550.13 | 1836.83 | 3352.37 | 3751.86 |
| 1967 | 3380.69 | 3369.72 | 5547.39 | 6706.41 | 8444.86 | 7242.54 | 6121.04 | 3438.23 | 2271.97 | 2163.05 | 3350.85 | 5663.4 | 4808.35 |
| 1968 | 8177.22 | 8092.8 | 5836.96 | 11060.6 | 8833.08 | 10048.8 | 5174.7 | 3696.74 | 2464.52 | 2429.78 | 2830.76 | 6063.49 | 6225.79 |
| 1969 | 6268.1 | 11173.1 | 8443.95 | 9999.68 | 10523.9 | 6187.27 | 6838.1 | 4477.74 | 2661.8 | 3205.3 | 3367.83 | 3694.91 | 6403.47 |
| 1970 | 6197.77 | 5941.51 | 8042.03 | 9102.03 | 12079.5 | 8094.89 | 3935.15 | 2997.03 | 2529.65 | 4914.37 | 5228.26 | 4194.57 | 6104.73 |
| 1971 | 6610.65 | 6445.15 | 10972.4 | 6514.8 | 6523.87 | 4989.46 | 3544.19 | 3978.99 | 2852.47 | 2525.69 | 2885.5 | 6896.56 | 5394.98 |
| 1972 | 8605.63 | 6606.65 | 8086.79 | 7401.12 | 10231.6 | 4406.13 | 4785.57 | 4193.66 | 3261.17 | 3990.87 | 8538.52 | 10920.3 | 6752.33 |
| 1973 | 12080.4 | 12051.9 | 11816.4 | 18128.5 | 20654.1 | 15625.3 | 8440.29 | 4675.96 | 3561.33 | 5319.03 | 5435.92 | 10575 | 10697 |
| 1974 | 11675.7 | 14339.5 | 10939.5 | 11606.2 | 9768.45 | 11767.6 | 8358.08 | 3643.76 | 5922.03 | 4332.5 | 6502.53 | 8111.45 | 8913.94 |
| 1975 | 9652.44 | 10612.8 | 13208.5 | 17843.5 | 14596 | 10634 | 6793.34 | 3908.66 | 3151.68 | 3646.5 | 3759.55 | 4572.74 | 8531.64 |
| 1976 | 6600.6 | 5984.65 | 10424.3 | 8274.23 | 5663.4 | 4323.06 | 4569.09 | 2146.61 | 1207.25 | 1604.93 | 2343.7 | 2517.47 | 4638.27 |
| 1977 | 2928.53 | 2819.56 | 7419.05 | 8695.21 | 4886.05 | 2567.41 | 3127.66 | 2385.02 | 3180 | 4548.08 | 5215.05 | 7302.13 | 4589.48 |
| 1978 | 6223.35 | 6466.39 | 6282.72 | 10917.2 | 9581.19 | 6601.64 | 4531.63 | 3711.35 | 2908.16 | 2245.26 | 2116.22 | 7116.7 | 5725.15 |
| 1979 | 8554.47 | 7961.12 | 12530.7 | 15967 | 15025.4 | 9569.26 | 5655.18 | 5570.23 | 5542.58 | 5241.38 | 4627 | 7166.94 | 8617.61 |
| 1980 | 6374.98 | 5140.02 | 6697.43 | 12236.7 | 7909.58 | 5862.56 | 4132.46 | 3271.07 | 3406.54 | 2865.5 | 2454.14 | 2980.59 | 5277.63 |
| 1981 | 1517.24 | 3080.49 | 4981.97 | 3978.54 | 5689.89 | 8967.05 | 6359.45 | 4870.52 | 3394.26 | 2802.47 | 4179.59 | 3213.52 | 4419.58 |
| 1982 | 4959.13 | 8991.66 | 9001.15 | 9549.44 | 6377.72 | 8818.86 | 6216.04 | 4274.04 | 4030.45 | 3163.28 | 3396.15 | 11147.8 | 6660.48 |
| 1983 | 12280.4 | 8938.06 | 8366.3 | 11594.9 | 15891.3 | 15162.8 | 6100.03 | 3453.76 | 1884.02 | 1863.44 | 3919.07 | 10101.9 | 8296.33 |
| 1984 | 5807.73 | 6528.53 | 10153 | 12712.4 | 13502.6 | 9986.46 | 6008.68 | 3740.58 | 2046.38 | 4066.69 | 7493.62 | 7530.5 | 7464.76 |
| 1985 | 9175.62 | 6816.31 | 12694.2 | 11234.3 | 7914.15 | 5670.01 | 3977.17 | 2856.36 | 3272.5 | 3996.35 | 6980.14 | 11573.4 | 7180.04 |
| 1986 | 5036.77 | 7236 | 7273.81 | 6706.41 | 6205.08 | 7654.09 | 5072.4 | 3009.82 | 2569.3 | 7680.3 | 8085.45 | 9172.88 | 6308.53 |
| 1987 | -9999 | -9999 | -9999 | -9999 | -9999 | -9999 | -9999 | -9999 | -9999 | -9999 | -9999 | -9999 | -9999 |
| 1988 | -9999 | -9999 | -9999 | -9999 | -9999 | -9999 | -9999 | -9999 | -9999 | -9999 | -9999 | -9999 | -9999 |
| |
|
|
|
|
|
|
|
|
|
|
|
|
|
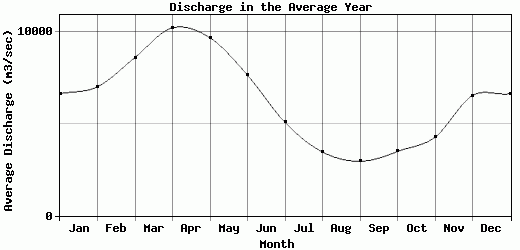
| Avg | 6646.79 | 7021.39 | 8614.16 | 10227.4 | 9685.41 | 7649.49 | 5080.26 | 3466.51 | 2965.61 | 3497.61 | 4274.35 | 6543.89 | 6306.07 |
| |
|
|
|
|
|
|
|
|
|
|
|
|
|
| Std Dev | 2981.41 |
2983.44 |
2543.25 |
3597.1 |
4008.37 |
3516.26 |
1740.03 |
1007.99 |
1111.38 |
1456.28 |
2032.57 |
2932.02 |
1808.35 |
| |
|
|
|
|
|
|
|
|
|
|
|
|
|
| | Jan | Feb | Mar | Apr | May | Jun | Jul | Aug | Sep | Oct | Nov | Dec | Avg Annual |
Click here for this table in tab-delimited format.
Tab-delimited format will open in most table browsing software, i.e. Excel, etc.
View this station on the map.
Return to start.