Results
| Country: | U.S.A.
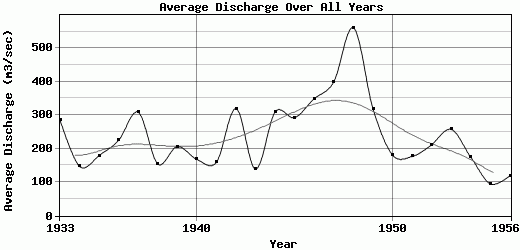
| | Station: | DECATUR, NE | | River: | MISSOURI RIVER | | Area: | 818805.87 | | Lat: | 42 | | Lon: | -96.24 | | Source: | USGS | | PointID: | 6601200 | | Area Units: | km2 | | Discharge Units: | m3/sec | | Starting Year: | 1933 | | Ending Year: | 1956 | | Total Years: | 24 | | Total Usable Years: | 24 | |
| |
| Year | Jan | Feb | Mar | Apr | May | Jun | Jul | Aug | Sep | Oct | Nov | Dec | Avg Annual |
|---|
| 1933 | 253.15 | 502.02 | 568.08 | 545.1 | 356.5 | 206.53 | 170.19 | 168.38 | 246.44 | 163.53 | 133.55 | 119.73 | 286.1 |
| 1934 | 110.34 | 105.68 | 123.39 | 115.86 | 108.36 | 257.79 | 221.06 | 211.86 | 161.27 | 132.82 | 116 | 105.07 | 147.46 |
| 1935 | 102.22 | 107.73 | 140.39 | 115.6 | 102.59 | 90.02 | 111.26 | 167.44 | 502.89 | 366.15 | 192.16 | 153.32 | 179.31 |
| 1936 | 190.09 | 345.6 | 405.76 | 359.63 | 252.09 | 167.45 | 142.02 | 227.47 | 157.03 | 163.52 | 140.76 | 146.49 | 224.83 |
| 1937 | 159.67 | 278.58 | 365.65 | 592.77 | 445.03 | 227.14 | 203.44 | 269.33 | 310.37 | 390.04 | 246.58 | 215.27 | 308.66 |
| 1938 | 205.89 | 197.25 | 164.49 | 144.94 | 119.19 | 111.48 | 128.76 | 190.05 | 144.83 | 151.94 | 165.3 | 129.45 | 154.46 |
| 1939 | 126.6 | 143.34 | 300.73 | 246.13 | 205.77 | 202.63 | 240.88 | 278.52 | 282.65 | 185.41 | 137.61 | 124.7 | 206.25 |
| 1940 | 128.81 | 205.85 | 261.8 | 220.26 | 158.74 | 129.89 | 169.69 | 240.22 | 179 | 117.86 | 102.22 | 99.02 | 167.78 |
| 1941 | 123.27 | 131.58 | 165.37 | 175.75 | 123.32 | 107.91 | 170.65 | 192.13 | 152.1 | 170.13 | 208.67 | 193.62 | 159.54 |
| 1942 | 494.64 | 443.26 | 743.73 | 601.83 | 289.32 | 231.49 | 212.89 | 196.65 | 182.15 | 169.68 | 138 | 129.81 | 319.45 |
| 1943 | 142.72 | 170.48 | 201.27 | 185.67 | 145.56 | 158.74 | 134.13 | 132.19 | 118.6 | 102.42 | 90.33 | 87.19 | 139.11 |
| 1944 | 100.21 | 158.77 | 329.54 | 589.84 | 470.68 | 214.18 | 275.57 | 403.65 | 371.42 | 309.36 | 281.22 | 210.94 | 309.62 |
| 1945 | 263.57 | 295.71 | 239.82 | 185.7 | 242.27 | 149.11 | 261.61 | 630.37 | 565.3 | 298.52 | 194.54 | 186.12 | 292.72 |
| 1946 | 410.41 | 414.04 | 352.94 | 370.9 | 301.49 | 295.96 | 294.62 | 498.38 | 444.01 | 375.98 | 246.58 | 185.81 | 349.26 |
| 1947 | 174.25 | 196.66 | 330.61 | 466.95 | 351.41 | 234.79 | 200.89 | 199.45 | 212.05 | 525.33 | 970.61 | 932.63 | 399.64 |
| 1948 | 757.34 | 599.54 | 945.61 | 1682.97 | 567.62 | 304.04 | 267.37 | 367.3 | 295.2 | 344.64 | 246.81 | 349.86 | 560.69 |
| 1949 | 408.22 | 426.17 | 384.2 | 385.02 | 277.37 | 202.06 | 260.5 | 279.91 | 477.33 | 312.83 | 222.48 | 183.68 | 318.31 |
| 1950 | 160.46 | 144.23 | 174.65 | 209.86 | 149.5 | 135.1 | 183.78 | 173.67 | 224.02 | 215.36 | 232.95 | 166.83 | 180.87 |
| 1951 | 149.66 | 146.19 | 155.98 | 277.91 | 183 | 124.09 | 111.01 | 132.37 | 144.9 | 182.77 | 256.33 | 257.43 | 176.8 |
| 1952 | 328.56 | 299.93 | 435.9 | 351.01 | 200.08 | 186.01 | 137.03 | 124.38 | 126.46 | 131.68 | 116.62 | 107.19 | 212.07 |
| 1953 | 115.56 | 182.21 | 235.2 | 297.84 | 249.85 | 159.02 | 166.48 | 230.72 | 359.06 | 511.26 | 271.27 | 310.34 | 257.4 |
| 1954 | 479.11 | 294.49 | 226.83 | 186.46 | 150.06 | 127.01 | 124.55 | 113.77 | 106.09 | 100.52 | 91.5 | 88.37 | 174.06 |
| 1955 | 90.84 | 109.86 | 100.36 | 109.93 | 97.33 | 87.96 | 83.17 | 81.28 | 112.65 | 105.51 | 83.54 | 75.52 | 94.83 |
| 1956 | 74.98 | 108.47 | 147.54 | 114.39 | 195.23 | 124.56 | 128.77 | 113.92 | 94.81 | 123.75 | 114.01 | 92.81 | 119.44 |
| |
|
|
|
|
|
|
|
|
|
|
|
|
|
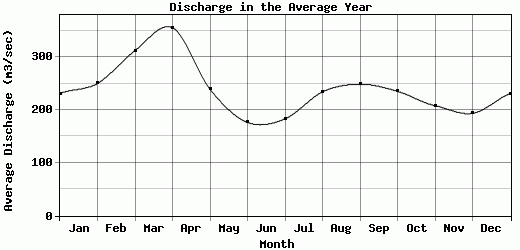
| Avg | 231.27 | 250.32 | 312.49 | 355.51 | 239.27 | 176.46 | 183.35 | 234.31 | 248.78 | 235.46 | 208.32 | 193.8 | 239.11 |
| |
|
|
|
|
|
|
|
|
|
|
|
|
|
| Std Dev | 164.73 |
137.3 |
198.39 |
318.9 |
122.65 |
60.33 |
58.91 |
126.33 |
135.74 |
125.86 |
170.84 |
168.69 |
103.78 |
| |
|
|
|
|
|
|
|
|
|
|
|
|
|
| | Jan | Feb | Mar | Apr | May | Jun | Jul | Aug | Sep | Oct | Nov | Dec | Avg Annual |
Click here for this table in tab-delimited format.
Tab-delimited format will open in most table browsing software, i.e. Excel, etc.
View this station on the map.
Return to start.