Results
| Country: | U.S.A.
| | Station: | ELBOWOODS, N. DAK. | | River: | MISSOURI RIVER | | Area: | 26183609.59 | | Lat: | 47.57 | | Lon: | -102.2 | | Source: | USGS | | PointID: | 6337500 | | Area Units: | km2 | | Discharge Units: | m3/sec | | Starting Year: | 1930 | | Ending Year: | 1971 | | Total Years: | 42 | | Total Usable Years: | 15 | |
| |
| Year | Jan | Feb | Mar | Apr | May | Jun | Jul | Aug | Sep | Oct | Nov | Dec | Avg Annual |
|---|
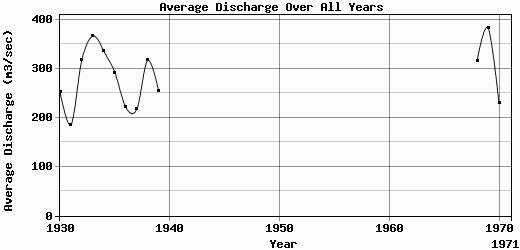
| 1930 | 59.98 | 72.48 | 68.64 | 268.6 | 528.34 | 897.18 | 502.39 | 227.3 | 148.2 | 109.28 | 85.59 | 65.38 | 252.78 |
| 1931 | 61.19 | 59.13 | 64.23 | 87.98 | 498.03 | 615.89 | 304.64 | 164.48 | 130.91 | 93.26 | 76.45 | 69.04 | 185.44 |
| 1932 | 54.96 | 73.41 | 104.32 | 205.99 | 815.34 | 1285.78 | 500.02 | 256.69 | 170.99 | 132.75 | 131.05 | 83.09 | 317.87 |
| 1933 | 86.13 | 67.11 | 78.75 | 184.05 | 645.81 | 1405.28 | 774.61 | 308.16 | 221.29 | 241.85 | 221.86 | 156.51 | 365.95 |
| 1934 | 142.23 | 109.31 | 139.12 | 693.72 | 1190.32 | 693.48 | 398.41 | 206.9 | 134.32 | 101.41 | 129.68 | 81.93 | 335.07 |
| 1935 | 82.85 | 94.04 | 83.7 | 144.03 | 614.99 | 1100.02 | 675.22 | 280.11 | 154.64 | 111.8 | 86.83 | 72.69 | 291.74 |
| 1936 | 64.69 | 47.17 | 70.34 | 262.11 | 792.05 | 654.03 | 276.83 | 162.38 | 115.71 | 82.81 | 61.37 | 56.37 | 220.49 |
| 1937 | 45.87 | 52.08 | 53.32 | 89.08 | 508.36 | 750.21 | 406.54 | 201.76 | 131.23 | 123.37 | 153.56 | 87.56 | 216.91 |
| 1938 | 84.42 | 67.01 | 82.95 | 277.37 | 904.13 | 1247.65 | 513.82 | 196.5 | 144.97 | 120.65 | 91.04 | 69.11 | 316.64 |
| 1939 | 75.87 | 57.94 | 82.28 | 236.74 | 710.03 | 663.94 | 497.83 | 191.75 | 133.05 | 151.72 | 134.81 | 101.67 | 253.14 |
| 1940 | -9999 | -9999 | -9999 | -9999 | -9999 | -9999 | -9999 | -9999 | -9999 | -9999 | -9999 | -9999 | -9999 |
| 1941 | -9999 | -9999 | -9999 | -9999 | -9999 | -9999 | -9999 | -9999 | -9999 | -9999 | -9999 | -9999 | -9999 |
| 1942 | -9999 | -9999 | -9999 | -9999 | -9999 | -9999 | -9999 | -9999 | -9999 | -9999 | -9999 | -9999 | -9999 |
| 1943 | -9999 | -9999 | -9999 | -9999 | -9999 | -9999 | -9999 | -9999 | -9999 | -9999 | -9999 | -9999 | -9999 |
| 1944 | -9999 | -9999 | -9999 | -9999 | -9999 | -9999 | -9999 | -9999 | -9999 | -9999 | -9999 | -9999 | -9999 |
| 1945 | -9999 | -9999 | -9999 | -9999 | -9999 | -9999 | -9999 | -9999 | -9999 | -9999 | -9999 | -9999 | -9999 |
| 1946 | -9999 | -9999 | -9999 | -9999 | -9999 | -9999 | -9999 | -9999 | -9999 | -9999 | -9999 | -9999 | -9999 |
| 1947 | -9999 | -9999 | -9999 | -9999 | -9999 | -9999 | -9999 | -9999 | -9999 | -9999 | -9999 | -9999 | -9999 |
| 1948 | -9999 | -9999 | -9999 | -9999 | -9999 | -9999 | -9999 | -9999 | -9999 | -9999 | -9999 | -9999 | -9999 |
| 1949 | -9999 | -9999 | -9999 | -9999 | -9999 | -9999 | -9999 | -9999 | -9999 | -9999 | -9999 | -9999 | -9999 |
| 1950 | -9999 | -9999 | -9999 | -9999 | -9999 | -9999 | -9999 | -9999 | -9999 | -9999 | -9999 | -9999 | -9999 |
| 1951 | -9999 | -9999 | -9999 | -9999 | -9999 | -9999 | -9999 | -9999 | -9999 | -9999 | -9999 | -9999 | -9999 |
| 1952 | -9999 | -9999 | -9999 | -9999 | -9999 | -9999 | -9999 | -9999 | -9999 | -9999 | -9999 | -9999 | -9999 |
| 1953 | -9999 | -9999 | -9999 | -9999 | -9999 | -9999 | -9999 | -9999 | -9999 | -9999 | -9999 | -9999 | -9999 |
| 1954 | -9999 | -9999 | -9999 | -9999 | -9999 | -9999 | -9999 | -9999 | -9999 | -9999 | -9999 | -9999 | -9999 |
| 1955 | -9999 | -9999 | -9999 | -9999 | -9999 | -9999 | -9999 | -9999 | -9999 | -9999 | -9999 | -9999 | -9999 |
| 1956 | -9999 | -9999 | -9999 | -9999 | -9999 | -9999 | -9999 | -9999 | -9999 | -9999 | -9999 | -9999 | -9999 |
| 1957 | -9999 | -9999 | -9999 | -9999 | -9999 | -9999 | -9999 | -9999 | -9999 | -9999 | -9999 | -9999 | -9999 |
| 1958 | -9999 | -9999 | -9999 | -9999 | -9999 | -9999 | -9999 | -9999 | -9999 | -9999 | -9999 | -9999 | -9999 |
| 1959 | -9999 | -9999 | -9999 | -9999 | -9999 | -9999 | -9999 | -9999 | -9999 | -9999 | -9999 | -9999 | -9999 |
| 1960 | -9999 | -9999 | -9999 | -9999 | -9999 | -9999 | -9999 | -9999 | -9999 | -9999 | -9999 | -9999 | -9999 |
| 1961 | -9999 | -9999 | -9999 | -9999 | -9999 | -9999 | -9999 | -9999 | -9999 | -9999 | -9999 | -9999 | -9999 |
| 1962 | -9999 | -9999 | -9999 | -9999 | -9999 | -9999 | -9999 | -9999 | -9999 | -9999 | -9999 | -9999 | -9999 |
| 1963 | -9999 | -9999 | -9999 | -9999 | -9999 | -9999 | -9999 | -9999 | -9999 | -9999 | -9999 | -9999 | -9999 |
| 1964 | -9999 | -9999 | -9999 | -9999 | -9999 | -9999 | -9999 | -9999 | -9999 | -9999 | -9999 | -9999 | -9999 |
| 1965 | -9999 | -9999 | -9999 | -9999 | -9999 | -9999 | -9999 | -9999 | -9999 | -9999 | -9999 | -9999 | -9999 |
| 1966 | -9999 | -9999 | -9999 | -9999 | -9999 | -9999 | -9999 | -9999 | -9999 | -9999 | -9999 | -9999 | -9999 |
| 1967 | -9999 | -9999 | -9999 | -9999 | -9999 | -9999 | -9999 | -9999 | -9999 | -9999 | -9999 | -9999 | -9999 |
| 1968 | 78.95 | 86.74 | 100.94 | 105.52 | 643.02 | 1191.86 | 657.69 | 279.7 | 212.07 | 182.78 | 145.5 | 99.12 | 315.32 |
| 1969 | 89.52 | 75.8 | 86.07 | 393.34 | 1109.57 | 1347.32 | 706.19 | 263.27 | 164.97 | 157.28 | 114.67 | 84.45 | 382.7 |
| 1970 | 64.62 | 76.72 | 76.35 | 93.57 | 530.7 | 918.51 | 359.05 | 182.76 | 145.81 | 123.95 | 92.71 | 79.79 | 228.71 |
| 1971 | -9999 | -9999 | -9999 | -9999 | -9999 | -9999 | -9999 | -9999 | -9999 | -9999 | -9999 | -9999 | -9999 |
| |
|
|
|
|
|
|
|
|
|
|
|
|
|
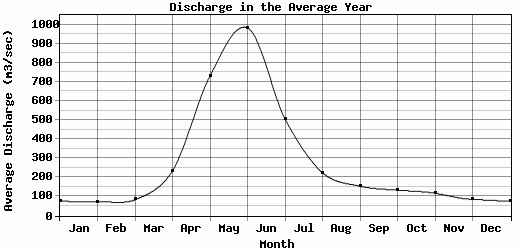
| Avg | 76.25 | 72.23 | 83.92 | 234.01 | 730.05 | 982.4 | 505.63 | 224.75 | 154.47 | 133.3 | 117.32 | 85.13 | 283.29 |
| |
|
|
|
|
|
|
|
|
|
|
|
|
|
| Std Dev | 23.01 |
16.55 |
20.73 |
159.45 |
216.44 |
280.71 |
151.96 |
46.05 |
30.17 |
40.86 |
40.88 |
24.02 |
59.19 |
| |
|
|
|
|
|
|
|
|
|
|
|
|
|
| | Jan | Feb | Mar | Apr | May | Jun | Jul | Aug | Sep | Oct | Nov | Dec | Avg Annual |
Click here for this table in tab-delimited format.
Tab-delimited format will open in most table browsing software, i.e. Excel, etc.
View this station on the map.
Return to start.