Results
| Country: | U.S.A.
| | Station: | FORT PECK DAM, MT. | | River: | MISSOURI RIVER | | Area: | 26053858.28 | | Lat: | 48.04 | | Lon: | -106.35 | | Source: | USGS | | PointID: | 6132000 | | Area Units: | km2 | | Discharge Units: | m3/sec | | Starting Year: | 1975 | | Ending Year: | 1984 | | Total Years: | 10 | | Total Usable Years: | 7 | |
| |
| Year | Jan | Feb | Mar | Apr | May | Jun | Jul | Aug | Sep | Oct | Nov | Dec | Avg Annual |
|---|
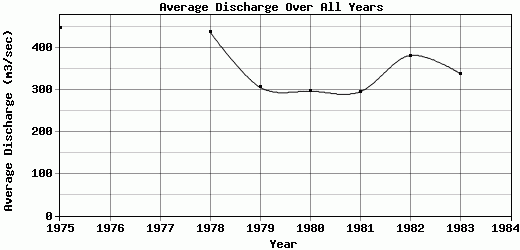
| 1975 | 193.04 | 185.61 | 261.63 | 282.57 | 678.33 | 1109.46 | 1220.1 | 439.46 | 252.11 | 247.19 | 262.51 | 251.45 | 448.62 |
| 1976 | -9999 | -9999 | -9999 | -9999 | -9999 | -9999 | -9999 | -9999 | -9999 | -9999 | -9999 | -9999 | -9999 |
| 1977 | -9999 | -9999 | -9999 | -9999 | -9999 | -9999 | -9999 | -9999 | -9999 | -9999 | -9999 | -9999 | -9999 |
| 1978 | 146.67 | 194.39 | 333.01 | 295.93 | 739.53 | 1087.84 | 968.35 | 404.66 | 340.74 | 294.64 | 243 | 216.5 | 438.77 |
| 1979 | 161.08 | 185.33 | 477.25 | 329.42 | 445.63 | 718.4 | 433.51 | 233.11 | 176.24 | 167.44 | 167.74 | 187.18 | 306.86 |
| 1980 | 150.47 | 207.4 | 237.99 | 271.86 | 502.4 | 685.37 | 412.51 | 191.54 | 249.62 | 266.91 | 208.57 | 183.73 | 297.36 |
| 1981 | 182.42 | 166.67 | 137.54 | 119.28 | 581.95 | 1048.48 | 436.71 | 155.24 | 130.22 | 190.39 | 204.82 | 194.88 | 295.72 |
| 1982 | 145.6 | 238.03 | 220.71 | 225.95 | 359.13 | 902.27 | 966.25 | 377.35 | 293.18 | 308.68 | 294.02 | 259.48 | 382.55 |
| 1983 | 230.04 | 215.68 | 217.35 | 211.89 | 351.3 | 790.52 | 734.42 | 300.07 | 247.04 | 308.67 | 291.67 | 174.98 | 339.47 |
| 1984 | -9999 | -9999 | -9999 | -9999 | -9999 | -9999 | -9999 | -9999 | -9999 | -9999 | -9999 | -9999 | -9999 |
| |
|
|
|
|
|
|
|
|
|
|
|
|
|
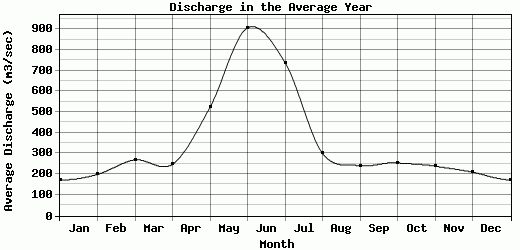
| Avg | 172.76 | 199.02 | 269.35 | 248.13 | 522.61 | 906.05 | 738.84 | 300.2 | 241.31 | 254.85 | 238.9 | 209.74 | 358.48 |
| |
|
|
|
|
|
|
|
|
|
|
|
|
|
| Std Dev | 28.88 |
21.73 |
100.54 |
64.42 |
140.02 |
165.61 |
299.29 |
102.52 |
64.77 |
52.61 |
43.98 |
31.34 |
60.77 |
| |
|
|
|
|
|
|
|
|
|
|
|
|
|
| | Jan | Feb | Mar | Apr | May | Jun | Jul | Aug | Sep | Oct | Nov | Dec | Avg Annual |
Click here for this table in tab-delimited format.
Tab-delimited format will open in most table browsing software, i.e. Excel, etc.
View this station on the map.
Return to start.