Results
| Country: | U.S.A.
| | Station: | Yankton,South Dakota | | River: | Missouri | | Area: | 273905 km2 | | Lat: | 42.86 | | Lon: | -97.4 | | Source: | RivDIS | | PointID: | 367 | | Area Units: | km2 | | Discharge Units: | m3/sec | | Starting Year: | 1930 | | Ending Year: | 1984 | | Total Years: | 55 | | Total Usable Years: | 54 | |
| |
| Year | Jan | Feb | Mar | Apr | May | Jun | Jul | Aug | Sep | Oct | Nov | Dec | Avg Annual |
|---|
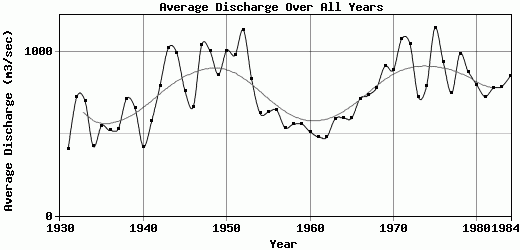
| 1930 | -9999 | -9999 | -9999 | -9999 | -9999 | -9999 | -9999 | -9999 | -9999 | 455 | 399 | 223 | -9999 |
| 1931 | 240 | 453 | 467 | 538 | 436 | 903 | 594 | 305 | 235 | 294 | 277 | 175 | 409.75 |
| 1932 | 197 | 243 | 605 | 903 | 1197 | 2191 | 1517 | 625 | 407 | 339 | 283 | 170 | 723.08 |
| 1933 | 253 | 250 | 758 | 900 | 1217 | 2021 | 1112 | 410 | 535 | 332 | 374 | 260 | 701.83 |
| 1934 | 206 | 320 | 721 | 581 | 741 | 844 | 535 | 255 | 193 | 242 | 288 | 162 | 424 |
| 1935 | 158 | 296 | 393 | 684 | 654 | 1624 | 1374 | 493 | 287 | 249 | 192 | 209 | 551.08 |
| 1936 | 204 | 205 | 1081 | 816 | 807 | 1130 | 604 | 338 | 288 | 262 | 316 | 198 | 520.75 |
| 1937 | 201 | 179 | 462 | 733 | 468 | 1592 | 1367 | 444 | 228 | 300 | 253 | 147 | 531.17 |
| 1938 | 200 | 199 | 947 | 580 | 517 | 1309 | 2094 | 794 | 690 | 507 | 449 | 303 | 715.75 |
| 1939 | 366 | 262 | 743 | 1565 | 866 | 1413 | 1023 | 468 | 297 | 277 | 322 | 287 | 657.42 |
| 1940 | 106 | 157 | 250 | 590 | 663 | 804 | 611 | 585 | 437 | 384 | 229 | 238 | 421.17 |
| 1941 | 197 | 203 | 308 | 758 | 592 | 1551 | 718 | 624 | 710 | 595 | 441 | 221 | 576.5 |
| 1942 | 193 | 242 | 547 | 768 | 2053 | 1981 | 1045 | 685 | 605 | 614 | 591 | 197 | 793.42 |
| 1943 | 236 | 243 | 939 | 2658 | 755 | 1832 | 1890 | 780 | 858 | 801 | 807 | 491 | 1024.17 |
| 1944 | 420 | 425 | 416 | 2163 | 715 | 2498 | 1945 | 870 | 690 | 670 | 751 | 398 | 996.75 |
| 1945 | 415 | 605 | 1480 | 747 | 412 | 1158 | 1300 | 763 | 663 | 813 | 546 | 252 | 762.83 |
| 1946 | 267 | 302 | 672 | 600 | 659 | 1256 | 1157 | 615 | 840 | 880 | 540 | 198 | 665.5 |
| 1947 | 287 | 380 | 683 | 1921 | 1264 | 2092 | 1755 | 1068 | 922 | 1031 | 766 | 345 | 1042.83 |
| 1948 | 353 | 345 | 953 | 1520 | 934 | 2084 | 1742 | 1130 | 838 | 1021 | 872 | 284 | 1006.33 |
| 1949 | 334 | 403 | 1211 | 2131 | 939 | 1173 | 894 | 754 | 814 | 820 | 601 | 267 | 861.75 |
| 1950 | 230 | 269 | 712 | 3225 | 1315 | 1080 | 1364 | 939 | 900 | 955 | 782 | 345 | 1009.67 |
| 1951 | 478 | 407 | 559 | 1788 | 942 | 1405 | 1123 | 1161 | 1236 | 1219 | 1068 | 383 | 980.75 |
| 1952 | 420 | 643 | 847 | 4757 | 1365 | 1390 | 871 | 816 | 800 | 814 | 651 | 253 | 1135.58 |
| 1953 | 367 | 423 | 959 | 735 | 1046 | 1840 | 1070 | 833 | 934 | 923 | 501 | 377 | 834 |
| 1954 | 289 | 414 | 587 | 722 | 757 | 678 | 839 | 863 | 894 | 817 | 329 | 316 | 625.42 |
| 1955 | 252 | 260 | 433 | 742 | 875 | 848 | 802 | 908 | 978 | 911 | 335 | 256 | 633.33 |
| 1956 | 240 | 275 | 674 | 818 | 820 | 842 | 851 | 937 | 961 | 733 | 334 | 260 | 645.42 |
| 1957 | 261 | 239 | 228 | 502 | 755 | 648 | 779 | 866 | 803 | 796 | 334 | 236 | 537.25 |
| 1958 | 249 | 246 | 272 | 659 | 744 | 791 | 735 | 799 | 818 | 848 | 273 | 265 | 558.25 |
| 1959 | 289 | 298 | 316 | 701 | 638 | 694 | 772 | 843 | 863 | 795 | 302 | 237 | 562.33 |
| 1960 | 254 | 232 | 304 | 395 | 534 | 588 | 729 | 789 | 774 | 770 | 532 | 263 | 513.67 |
| 1961 | 268 | 222 | 266 | 637 | 662 | 616 | 794 | 778 | 780 | 356 | 166 | 237 | 481.83 |
| 1962 | 254 | 218 | 275 | 310 | 520 | 532 | 682 | 643 | 708 | 718 | 648 | 241 | 479.08 |
| 1963 | 232 | 154 | 299 | 735 | 752 | 714 | 852 | 820 | 788 | 823 | 681 | 239 | 590.75 |
| 1964 | 175 | 197 | 370 | 684 | 707 | 753 | 813 | 893 | 764 | 833 | 733 | 260 | 598.5 |
| 1965 | 217 | 223 | 250 | 547 | 686 | 671 | 755 | 896 | 800 | 837 | 788 | 480 | 595.83 |
| 1966 | 462 | 469 | 508 | 730 | 783 | 844 | 947 | 901 | 872 | 904 | 822 | 349 | 715.92 |
| 1967 | 463 | 469 | 508 | 729 | 783 | 844 | 947 | 901 | 872 | 987 | 860 | 469 | 736 |
| 1968 | 412 | 475 | 654 | 908 | 911 | 938 | 994 | 957 | 890 | 852 | 898 | 495 | 782 |
| 1969 | 465 | 490 | 524 | 650 | 961 | 970 | 971 | 1500 | 1480 | 1300 | 1130 | 539 | 915 |
| 1970 | 445 | 479 | 673 | 805 | 843 | 978 | 1141 | 1270 | 1174 | 1170 | 1130 | 554 | 888.5 |
| 1971 | 442 | 487 | 710 | 983 | 1250 | 1360 | 1354 | 1360 | 1365 | 1420 | 1470 | 759 | 1080 |
| 1972 | 558 | 562 | 744 | 1140 | 1070 | 1160 | 1265 | 1350 | 1360 | 1410 | 1310 | 650 | 1048.25 |
| 1973 | 585 | 576 | 569 | 651 | 802 | 833 | 854 | 901 | 896 | 760 | 803 | 487 | 726.42 |
| 1974 | 484 | 509 | 640 | 851 | 852 | 857 | 1010 | 1000 | 994 | 992 | 849 | 497 | 794.58 |
| 1975 | 494 | 489 | 560 | 823 | 920 | 1090 | 1530 | 1780 | 1770 | 1770 | 1760 | 798 | 1148.67 |
| 1976 | 608 | 681 | 886 | 1020 | 1020 | 1090 | 1090 | 1090 | 1080 | 1010 | 1030 | 646 | 937.58 |
| 1977 | 519 | 447 | 586 | 837 | 881 | 896 | 942 | 927 | 888 | 872 | 788 | 406 | 749.08 |
| 1978 | 433 | 448 | 515 | 652 | 820 | 1100 | 1320 | 1460 | 1450 | 1480 | 1480 | 740 | 991.5 |
| 1979 | 570 | 643 | 428 | 811 | 1080 | 1140 | 1050 | 994 | 1010 | 1080 | 1000 | 738 | 878.67 |
| 1980 | 546 | 465 | 573 | 888 | 844 | 810 | 1006 | 998 | 1011 | 1018 | 979 | 472 | 800.83 |
| 1981 | 411 | 407 | 641 | 952 | 930 | 887 | 918 | 883 | 906 | 895 | 517 | 386 | 727.75 |
| 1982 | 408 | 404 | 504 | 793 | 771 | 782 | 861 | 888 | 896 | 1026 | 1199 | 829 | 780.08 |
| 1983 | 676 | 673 | 590 | 477 | 684 | 567 | 803 | 1081 | 1084 | 1089 | 1055 | 685 | 788.67 |
| 1984 | 523 | 526 | 599 | 434 | 558 | 484 | 1065 | 1336 | 1329 | 1320 | 1343 | 706 | 851.92 |
| |
|
|
|
|
|
|
|
|
|
|
|
|
|
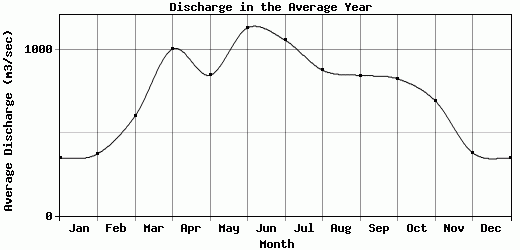
| Avg | 348.37 | 372.8 | 599.98 | 1004.57 | 847.59 | 1132.89 | 1058.81 | 877.17 | 845.65 | 825.25 | 694.13 | 379.6 | 750.17 |
| |
|
|
|
|
|
|
|
|
|
|
|
|
|
| Std Dev | 136.71 |
144.42 |
253.45 |
760.05 |
274.9 |
478.91 |
353.25 |
300.41 |
323.95 |
339.14 |
372.01 |
186.07 |
195.47 |
| |
|
|
|
|
|
|
|
|
|
|
|
|
|
| | Jan | Feb | Mar | Apr | May | Jun | Jul | Aug | Sep | Oct | Nov | Dec | Avg Annual |
Click here for this table in tab-delimited format.
Tab-delimited format will open in most table browsing software, i.e. Excel, etc.
View this station on the map.
Return to start.