Results
| Country: | U.S.A.
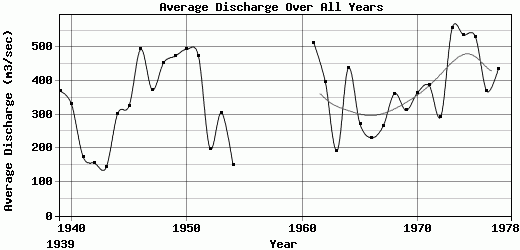
| | Station: | MT VERNON AL | | River: | MOBILE RIVER | | Area: | 111363.40 | | Lat: | 31.09 | | Lon: | -87.97 | | Source: | USGS | | PointID: | 2470500 | | Area Units: | km2 | | Discharge Units: | m3/sec | | Starting Year: | 1939 | | Ending Year: | 1978 | | Total Years: | 40 | | Total Usable Years: | 33 | |
| |
| Year | Jan | Feb | Mar | Apr | May | Jun | Jul | Aug | Sep | Oct | Nov | Dec | Avg Annual |
|---|
| 1939 | 321.17 | 1152.2 | 729.9 | 676.12 | 299.74 | 846.4 | 168.24 | 85.46 | 38.89 | 32.63 | 32.72 | 60.16 | 370.3 |
| 1940 | 119.46 | 727.5 | 577.91 | 489.7 | 146 | 129.79 | 1039.11 | 81.96 | 41.32 | 26.35 | 158.97 | 431.42 | 330.79 |
| 1941 | 293.74 | 316.01 | 449.24 | 239.01 | 52.49 | 24.87 | 164.67 | 132.94 | 32.19 | 32.52 | 124.06 | 242.38 | 175.34 |
| 1942 | 168.93 | 380.88 | 606.1 | 205.97 | 84.59 | 63.88 | 40.92 | 80.65 | 32.59 | 18.89 | 31.89 | 149.81 | 155.43 |
| 1943 | 219.52 | 220.18 | 699.53 | 250.02 | 101.16 | 36.38 | 34.45 | 23.64 | 36.18 | 13.77 | 42.42 | 38.13 | 142.95 |
| 1944 | 119.08 | 433.08 | 864.54 | 1341.56 | 478.61 | 60.56 | 34.13 | 72.89 | 57.42 | 23.91 | 28.66 | 123.38 | 303.15 |
| 1945 | 515.04 | 917.27 | 1170.68 | 431.44 | 232.44 | 80.76 | 74.15 | 76.24 | 30.28 | 45.06 | 85.01 | 265.15 | 326.96 |
| 1946 | 1281.88 | 1628.63 | 783.01 | 327.4 | 312.5 | 258.29 | 407.6 | 245.22 | 59.47 | 44.69 | 328.41 | 254.48 | 494.3 |
| 1947 | 1417.04 | 414.81 | 664.24 | 850.64 | 199.54 | 275.67 | 126.94 | 49.18 | 44 | 24.43 | 145.84 | 271.65 | 373.67 |
| 1948 | 256.23 | 1558.41 | 1181.73 | 640.5 | 109.53 | 59 | 51.28 | 49.29 | 44.24 | 30.26 | 446.08 | 1034.85 | 455.12 |
| 1949 | 1948.3 | 1201.25 | 586.69 | 741.1 | 440.47 | 201.38 | 116.89 | 76.52 | 99.66 | 46.38 | 77.02 | 153.51 | 474.1 |
| 1950 | 1296.01 | 1301.07 | 1036.86 | 253.52 | 303.44 | 152.13 | 129.15 | 136.3 | 690.63 | 98.1 | 172.45 | 364.29 | 494.5 |
| 1951 | 743.8 | 1340.1 | 862.48 | 1589.53 | 185.24 | 134.42 | 92.55 | 38.96 | 30.67 | 29.53 | 76.54 | 570.39 | 474.52 |
| 1952 | 551.18 | 504.43 | 630.56 | 358.3 | 90.28 | 44.35 | 23.76 | 34.32 | 24.8 | 20.25 | 35.56 | 73.24 | 199.25 |
| 1953 | 409.92 | 736.32 | 909.71 | 346.68 | 936 | 53.1 | 128.42 | 28.75 | 19.26 | 15.34 | 20.06 | 67.65 | 305.93 |
| 1954 | 445.26 | 278.77 | 216.63 | 405.33 | 254.47 | 37.82 | 25.62 | 12.31 | 9.28 | 13.16 | 22.94 | 65.77 | 148.95 |
| 1955 | -9999 | -9999 | -9999 | -9999 | -9999 | -9999 | -9999 | -9999 | -9999 | -9999 | -9999 | -9999 | -9999 |
| 1956 | -9999 | -9999 | -9999 | -9999 | -9999 | -9999 | -9999 | -9999 | -9999 | -9999 | -9999 | -9999 | -9999 |
| 1957 | -9999 | -9999 | -9999 | -9999 | -9999 | -9999 | -9999 | -9999 | -9999 | -9999 | -9999 | -9999 | -9999 |
| 1958 | -9999 | -9999 | -9999 | -9999 | -9999 | -9999 | -9999 | -9999 | -9999 | -9999 | -9999 | -9999 | -9999 |
| 1959 | -9999 | -9999 | -9999 | -9999 | -9999 | -9999 | -9999 | -9999 | -9999 | -9999 | -9999 | -9999 | -9999 |
| 1960 | -9999 | -9999 | -9999 | -9999 | -9999 | -9999 | -9999 | -9999 | -9999 | -9999 | -9999 | -9999 | -9999 |
| 1961 | 232.14 | 882.01 | 1239.55 | 978.12 | 184.31 | 128.02 | 227.34 | 85.88 | 51.86 | 39.75 | 326.89 | 1772.72 | 512.38 |
| 1962 | 1146.93 | 944.29 | 939.03 | 1160.15 | 145.21 | 133 | 72.65 | 57.48 | 49.63 | 24.68 | 36.42 | 50.39 | 396.66 |
| 1963 | 110.85 | 186.03 | 499.01 | 120.5 | 263.21 | 244.06 | 471.3 | 85.21 | 42.31 | 20.67 | 36.81 | 227.51 | 192.29 |
| 1964 | 522.4 | 449.95 | 1278.83 | 1368.94 | 610.52 | 76.87 | 138.58 | 97.66 | 49.48 | 91.52 | 102.21 | 476.31 | 438.61 |
| 1965 | 351.76 | 1106.56 | 671.66 | 671.11 | 80.82 | 67.42 | 63.14 | 60.08 | 58.37 | 51.25 | 37.95 | 46 | 272.18 |
| 1966 | 212.18 | 791.17 | 317.34 | 424.08 | 530.39 | 69.13 | 38.79 | 47.37 | 66.62 | 50.32 | 63.63 | 165.8 | 231.4 |
| 1967 | 166.64 | 324.89 | 264.54 | 106.41 | 284.4 | 59.65 | 273.34 | 203.46 | 59.6 | 45.33 | 101.9 | 1291.48 | 265.14 |
| 1968 | 1389.48 | 206.9 | 681.5 | 591.71 | 645.6 | 90.38 | 214.44 | 80.23 | 58.06 | 37.84 | 60.37 | 297.9 | 362.87 |
| 1969 | 200.5 | 743.31 | 503.7 | 1407.84 | 214.12 | 67.81 | 45.58 | 44.03 | 45.47 | 57.06 | 93.43 | 326.6 | 312.45 |
| 1970 | 771.2 | 346.99 | 923.75 | 946.64 | 692.88 | 137.85 | 45.97 | 71.84 | 38.25 | 132.37 | 121.6 | 162.25 | 365.97 |
| 1971 | 399.47 | 729.32 | 1286.23 | 456.73 | 634.9 | 87.95 | 107.74 | 110.01 | 131.82 | 57.16 | 53.47 | 587.62 | 386.87 |
| 1972 | 1121.28 | 366.17 | 491.18 | 282.94 | 223 | 62.42 | 72.68 | 48.21 | 44.47 | 54.05 | 162.44 | 595.42 | 293.69 |
| 1973 | 1068.74 | 810.47 | 1622.47 | 1015.73 | 537.54 | 288.74 | 181.2 | 74.27 | 48.2 | 63.27 | 237.66 | 746.64 | 557.91 |
| 1974 | 1634.44 | 1289.74 | 472.14 | 1038.3 | 449.21 | 486.58 | 100.63 | 83.52 | 232.81 | 62.2 | 130.01 | 460.55 | 536.68 |
| 1975 | 1238 | 980.78 | 1263.22 | 744.31 | 361.08 | 230.33 | 143.82 | 265.75 | 113.87 | 478.73 | 219.79 | 337.52 | 531.43 |
| 1976 | 609.61 | 607.71 | 1243.83 | 734.76 | 424.74 | 153.11 | 84.28 | 63.48 | 114.55 | 62.16 | 78.84 | 258.81 | 369.66 |
| 1977 | 605.7 | 265.62 | 1417.31 | 1049.36 | 110.47 | 62.36 | 60.61 | 56.16 | 121.49 | 320.77 | 520.11 | 656.22 | 437.18 |
| 1978 | -9999 | -9999 | -9999 | -9999 | -9999 | -9999 | -9999 | -9999 | -9999 | -9999 | -9999 | -9999 | -9999 |
| |
|
|
|
|
|
|
|
|
|
|
|
|
|
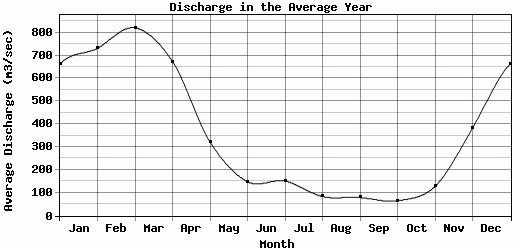
| Avg | 663.27 | 731.6 | 820.76 | 674.07 | 321.78 | 148.62 | 151.51 | 83.61 | 79.33 | 65.59 | 127.64 | 382.61 | 354.2 |
| |
|
|
|
|
|
|
|
|
|
|
|
|
|
| Std Dev | 503.81 |
409.8 |
352.37 |
400.72 |
212.59 |
156.77 |
186.56 |
56.47 |
115.99 |
90.69 |
120.29 |
375.64 |
120.28 |
| |
|
|
|
|
|
|
|
|
|
|
|
|
|
| | Jan | Feb | Mar | Apr | May | Jun | Jul | Aug | Sep | Oct | Nov | Dec | Avg Annual |
Click here for this table in tab-delimited format.
Tab-delimited format will open in most table browsing software, i.e. Excel, etc.
View this station on the map.
Return to start.