Results
| Country: | Canada
| | Station: | QNSLR | | River: | Moisie | | Area: | 19000 km2 | | Lat: | 50.35 | | Lon: | -66.18 | | Source: | RivDIS | | PointID: | 323 | | Area Units: | km2 | | Discharge Units: | m3/sec | | Starting Year: | 1966 | | Ending Year: | 1984 | | Total Years: | 19 | | Total Usable Years: | 19 | |
| |
| Year | Jan | Feb | Mar | Apr | May | Jun | Jul | Aug | Sep | Oct | Nov | Dec | Avg Annual |
|---|
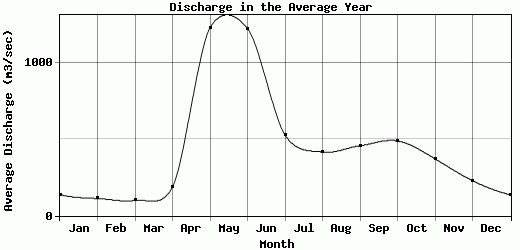
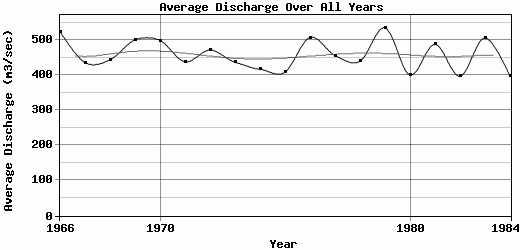
| 1966 | 118 | 100 | 83 | 136 | 860 | 1580 | 750 | 504 | 412 | 566 | 792 | 386 | 523.92 |
| 1967 | 201 | 119 | 87 | 76 | 555 | 1347 | 522 | 437 | 391 | 730 | 500 | 267 | 436 |
| 1968 | 136 | 135 | 131 | 413 | 1140 | 629 | 445 | 555 | 552 | 510 | 385 | 292 | 443.58 |
| 1969 | 163 | 123 | 115 | 111 | 730 | 1770 | 544 | 382 | 527 | 558 | 626 | 357 | 500.5 |
| 1970 | 278 | 209 | 138 | 144 | 1160 | 1570 | 730 | 433 | 445 | 399 | 309 | 172 | 498.92 |
| 1971 | 105 | 77.5 | 71.5 | 251 | 1470 | 637 | 430 | 402 | 498 | 713 | 368 | 236 | 438.25 |
| 1972 | 167 | 115 | 96.5 | 70 | 648 | 1860 | 626 | 317 | 569 | 663 | 309 | 219 | 471.63 |
| 1973 | 108 | 76 | 62 | 89.5 | 1640 | 968 | 651 | 388 | 343 | 388 | 314 | 214 | 436.79 |
| 1974 | 103 | 91 | 102 | 112 | 677 | 1730 | 413 | 433 | 408 | 396 | 268 | 268 | 416.75 |
| 1975 | 102 | 64 | 72 | 91 | 1070 | 1300 | 507 | 368 | 408 | 331 | 334 | 254 | 408.42 |
| 1976 | 140 | 139 | 94.5 | 289 | 1710 | 886 | 337 | 612 | 856 | 508 | 331 | 187 | 507.46 |
| 1977 | 132 | 106 | 95 | 161 | 1410 | 1170 | 396 | 378 | 487 | 592 | 372 | 175 | 456.17 |
| 1978 | 124 | 104 | 91.5 | 87.5 | 1360 | 1320 | 525 | 354 | 410 | 506 | 258 | 136 | 439.67 |
| 1979 | 97 | 95 | 101 | 341 | 1860 | 1180 | 645 | 591 | 528 | 431 | 362 | 187 | 534.83 |
| 1980 | 144 | 110 | 94.5 | 160 | 1450 | 758 | 434 | 359 | 332 | 509 | 292 | 169 | 400.96 |
| 1981 | 133 | 197 | 233 | 210 | 1510 | 1660 | 514 | 317 | 214 | 390 | 252 | 224 | 487.83 |
| 1982 | 110 | 72 | 58.5 | 70.5 | 1020 | 1200 | 600 | 350 | 427 | 315 | 352 | 190 | 397.08 |
| 1983 | 128 | 99 | 94.5 | 572 | 1740 | 878 | 483 | 416 | 569 | 514 | 359 | 218 | 505.88 |
| 1984 | 127 | 104 | 93 | 184 | 1390 | 879 | 498 | 326 | 348 | 301 | 301 | 211 | 396.83 |
| |
|
|
|
|
|
|
|
|
|
|
|
|
|
| Avg | 137.68 | 112.39 | 100.71 | 187.82 | 1231.58 | 1227.47 | 528.95 | 416.95 | 459.16 | 490.53 | 372.84 | 229.58 | 457.97 |
| |
|
|
|
|
|
|
|
|
|
|
|
|
|
| Std Dev | 41.63 |
36.76 |
36.84 |
130.49 |
389.64 |
381.46 |
110.02 |
86.49 |
129.72 |
124.1 |
130.23 |
61.94 |
43.7 |
| |
|
|
|
|
|
|
|
|
|
|
|
|
|
| | Jan | Feb | Mar | Apr | May | Jun | Jul | Aug | Sep | Oct | Nov | Dec | Avg Annual |
Click here for this table in tab-delimited format.
Tab-delimited format will open in most table browsing software, i.e. Excel, etc.
View this station on the map.
Return to start.