Results
| Country: | U.S.A.
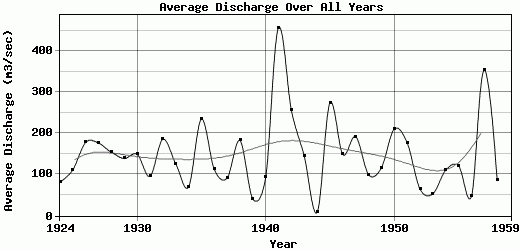
| | Station: | ELIZABETH, PA. | | River: | MONONGAHELA R | | Area: | 13829.78 | | Lat: | 40.26 | | Lon: | -79.9 | | Source: | USGS | | PointID: | 3075070 | | Area Units: | km2 | | Discharge Units: | m3/sec | | Starting Year: | 1924 | | Ending Year: | 1959 | | Total Years: | 36 | | Total Usable Years: | 35 | |
| |
| Year | Jan | Feb | Mar | Apr | May | Jun | Jul | Aug | Sep | Oct | Nov | Dec | Avg Annual |
|---|
| 1924 | 79.99 | 48.67 | 140.58 | 271.66 | 176.41 | 75.61 | 47.58 | 38 | 31.43 | 31.09 | 20.88 | 19.3 | 81.77 |
| 1925 | 20.98 | 21.1 | 16.43 | 144.06 | 217.22 | 34.67 | 16.28 | 112.95 | 477.75 | 174.55 | 80.27 | 21.5 | 111.48 |
| 1926 | 44.77 | 28.87 | 54.89 | 169.96 | 167.11 | 95.99 | 208.64 | 255.71 | 142.08 | 755.08 | 71.85 | 144.44 | 178.28 |
| 1927 | 127.12 | 134.14 | 130.07 | 745.33 | 115.11 | 163.63 | 242.78 | 121.43 | 50.25 | 175.37 | 36.74 | 78.67 | 176.72 |
| 1928 | 62.43 | 80.4 | 48.4 | 178.6 | 469.23 | 558.67 | 229.35 | 85.54 | 25.22 | 12.94 | 60.47 | 40.72 | 154.33 |
| 1929 | 46.86 | 35.79 | 94.94 | 132.42 | 500.49 | 277.71 | 100.06 | 23.74 | 271.09 | 64.92 | 70.73 | 48.39 | 138.93 |
| 1930 | 47.54 | 146.32 | 60.6 | 39.42 | 620.88 | 245.2 | 37.76 | 16.46 | 26.58 | 277.21 | 49.41 | 229.28 | 149.72 |
| 1931 | 41.46 | 159.27 | 124.57 | 106.59 | 131.07 | 43.65 | 94.62 | 24.07 | 9.88 | 136.53 | 141.48 | 133.62 | 95.57 |
| 1932 | 385.88 | 333.65 | 84.12 | 86.81 | 165.05 | 437.06 | 358.9 | 73.06 | 100.7 | 38.8 | 18.1 | 148.59 | 185.89 |
| 1933 | 81.2 | 33.71 | 158.66 | 92.23 | 613.55 | 81.9 | 47.02 | 142.48 | 155.35 | 48.61 | 29.8 | 33.61 | 126.51 |
| 1934 | 52.19 | 51.17 | 141.89 | 85.26 | 106.17 | 63.33 | 12.86 | 5.94 | 151.6 | 38.14 | 91.46 | 32.7 | 69.39 |
| 1935 | 23.53 | 18.38 | 176.27 | 88.46 | 1238.96 | 634.19 | 170.04 | 68.28 | 162.6 | 45.15 | 46.84 | 143.2 | 234.66 |
| 1936 | 33.13 | 25.46 | 29.84 | 18.64 | 252.83 | 194.51 | 34.84 | 11.82 | 468.96 | 208.08 | 34.07 | 40.06 | 112.69 |
| 1937 | 71.73 | 40.62 | 84.98 | 115.43 | 48.58 | 312.42 | 39.56 | 120.59 | 86.03 | 106.88 | 27.41 | 43.83 | 91.51 |
| 1938 | 74.32 | 561.03 | 293.65 | 221.31 | 528.44 | 326.63 | 72.98 | 42.73 | 27.44 | 15.07 | 19.43 | 10.95 | 182.83 |
| 1939 | 47.38 | 23.07 | 28.29 | 68.96 | 41.58 | 115.05 | 66.07 | 53.63 | 11.36 | 11.68 | 11.39 | 6.8 | 40.44 |
| 1940 | 5.15 | 13.97 | 7.06 | 99.82 | 210.93 | 201.01 | 205.02 | 104.72 | 39.09 | 10.69 | 122.59 | 94.71 | 92.9 |
| 1941 | 64.68 | 204.31 | 66.76 | 267.97 | 909.38 | 1472.11 | 219.1 | 101.27 | 146.55 | 1161.87 | 720.86 | 148.63 | 456.96 |
| 1942 | 82.01 | 81.61 | 90.33 | 1230.45 | 412.68 | 310.02 | 81.43 | 77.04 | 173.86 | 219.23 | 232.64 | 82.53 | 256.15 |
| 1943 | 83.1 | 52.25 | 72.32 | 272.82 | 771.24 | 333.72 | 60.7 | 19.49 | 19.38 | 20.98 | 13.66 | 12.66 | 144.36 |
| 1944 | 7.83 | 6.71 | 5.72 | 7.16 | 3.92 | 11 | 4.67 | 19.29 | 3.14 | 4.17 | 3.56 | 17.34 | 7.88 |
| 1945 | 7.67 | 19.21 | 244.08 | 577.67 | 576.14 | 224.27 | 561.85 | 138.05 | 77.12 | 775.01 | 66.95 | 28.52 | 274.71 |
| 1946 | 119.76 | 267.86 | 134.33 | 116.01 | 106.08 | 251.05 | 125.61 | 61.13 | 56.42 | 84.41 | 138 | 324.92 | 148.8 |
| 1947 | 145.03 | 122.14 | 61.45 | 178.91 | 645.34 | 738.38 | 119.42 | 66.12 | 65.54 | 62.22 | 37.98 | 66.58 | 192.43 |
| 1948 | 68.93 | 73.73 | 76.14 | 98.16 | 80.39 | 169.77 | 329.86 | 72.18 | 60.16 | 52.06 | 61.33 | 56.19 | 99.91 |
| 1949 | 72.77 | 68.26 | 83.09 | 66.53 | 257.34 | 397.57 | 65.33 | 69.57 | 69.42 | 83.42 | 78.3 | 83.52 | 116.26 |
| 1950 | 71.88 | 87.9 | 50.18 | 67.35 | 392.56 | 245.25 | 204.06 | 724.09 | 292.41 | 227.36 | 83 | 84.83 | 210.91 |
| 1951 | 81.85 | 93.55 | 66.11 | 59.18 | 393.26 | 735.22 | 385.63 | 88.34 | 72.57 | 52.13 | 47 | 51.38 | 177.19 |
| 1952 | 75.17 | 52.03 | 53.66 | 85.82 | 69.7 | 80.53 | 76.7 | 88.91 | 47.92 | 67.79 | 42.94 | 38.38 | 64.96 |
| 1953 | 42.57 | 35.9 | 20.12 | 49.5 | 41.81 | 59.68 | 71.28 | 83.03 | 75.72 | 62.18 | 33.58 | 62.91 | 53.19 |
| 1954 | 56.91 | 62.17 | 70.58 | 76.92 | 351.11 | 270.56 | 130.5 | 90.25 | 69.72 | 31.41 | 55.77 | 58.83 | 110.39 |
| 1955 | 9.21 | 28.76 | 23.26 | 33.25 | 90.69 | 329.49 | 101.02 | 101.93 | 76.12 | 417.93 | 135.17 | 114.75 | 121.8 |
| 1956 | 102.7 | 113.73 | 63.71 | 30.84 | 58.24 | 41.02 | 44.75 | 39.09 | 40.3 | 1.89 | 2.25 | 19.16 | 46.47 |
| 1957 | 59.88 | 42.84 | 41.95 | 90.64 | 982.8 | 1896.11 | 357.04 | 69.47 | 137.95 | 161.96 | 261.72 | 148.96 | 354.28 |
| 1958 | 47.26 | 124.51 | 45.59 | 87.65 | 326.28 | 66.39 | 80.86 | 70.37 | 45.69 | 51.62 | 54.14 | 42.01 | 86.86 |
| 1959 | -9999 | -9999 | -9999 | -9999 | -9999 | -9999 | -9999 | -9999 | -9999 | -9999 | -9999 | -9999 | -9999 |
| |
|
|
|
|
|
|
|
|
|
|
|
|
|
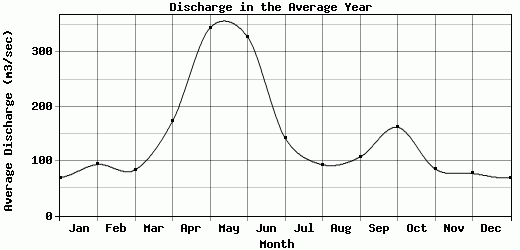
| Avg | 69.85 | 94.09 | 84.13 | 173.19 | 344.93 | 328.38 | 142.98 | 93.74 | 107.64 | 162.53 | 85.76 | 77.5 | 147.06 |
| |
|
|
|
|
|
|
|
|
|
|
|
|
|
| Std Dev | 63.13 |
107.34 |
62.56 |
232.7 |
298.44 |
386.69 |
126.36 |
117.97 |
112.24 |
248.28 |
123.06 |
66.78 |
88.43 |
| |
|
|
|
|
|
|
|
|
|
|
|
|
|
| | Jan | Feb | Mar | Apr | May | Jun | Jul | Aug | Sep | Oct | Nov | Dec | Avg Annual |
Click here for this table in tab-delimited format.
Tab-delimited format will open in most table browsing software, i.e. Excel, etc.
View this station on the map.
Return to start.