Results
| Country: | India
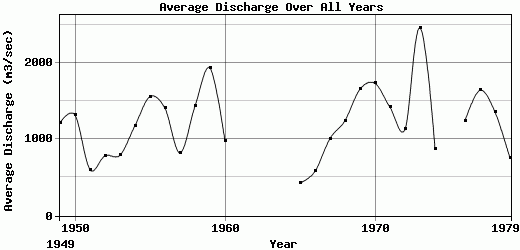
| | Station: | Garudeshwar | | River: | Narmada | | Area: | 89345 km2 | | Lat: | 21.92 | | Lon: | 73.65 | | Source: | RivDIS | | PointID: | 846 | | Area Units: | km2 | | Discharge Units: | m3/sec | | Starting Year: | 1949 | | Ending Year: | 1979 | | Total Years: | 31 | | Total Usable Years: | 26 | |
| |
| Year | Jan | Feb | Mar | Apr | May | Jun | Jul | Aug | Sep | Oct | Nov | Dec | Avg Annual |
|---|
| 1949 | 117 | 117 | 87 | 60 | 35 | 219 | 1468 | 2887 | 7552 | 1992 | 60 | 55 | 1220.75 |
| 1950 | 160 | 117 | 109 | 65 | 43 | 52 | 3887 | 4745 | 5455 | 781 | 278 | 167 | 1321.58 |
| 1951 | 155 | 87 | 64 | 63 | 43 | 149 | 1085 | 3183 | 1775 | 363 | 159 | 115 | 603.42 |
| 1952 | 83 | 66 | 48 | 29 | 15 | 321 | 1482 | 4929 | 1920 | 300 | 158 | 98 | 787.42 |
| 1953 | 78 | 66 | 42 | 24 | 14 | 222 | 1555 | 5354 | 1490 | 388 | 168 | 115 | 793 |
| 1954 | 287 | 51 | 35 | 21 | 13 | 63 | 1410 | 2018 | 7979 | 1975 | 160 | 154 | 1180.5 |
| 1955 | 164 | 58 | 36 | 27 | 17 | 296 | 1199 | 3613 | 9171 | 3255 | 603 | 297 | 1561.33 |
| 1956 | 218 | 179 | 114 | 85 | 50 | 495 | 5122 | 6324 | 2093 | 1302 | 644 | 263 | 1407.42 |
| 1957 | 136 | 150 | 122 | 120 | 58 | 295 | 1160 | 4641 | 2477 | 370 | 214 | 143 | 823.83 |
| 1958 | 118 | 85 | 86 | 52 | 27 | 121 | 1854 | 7783 | 5025 | 1736 | 251 | 92 | 1435.83 |
| 1959 | 69 | 44 | 31 | 18 | 10 | 37 | 480 | 7591 | 11246 | 2524 | 817 | 375 | 1936.83 |
| 1960 | 419 | 269 | 160 | 124 | 83 | 297 | 1578 | 6265 | 1333 | 899 | 204 | 120 | 979.25 |
| 1961 | -9999 | -9999 | -9999 | -9999 | -9999 | -9999 | -9999 | -9999 | -9999 | -9999 | -9999 | -9999 | -9999 |
| 1962 | -9999 | -9999 | -9999 | -9999 | -9999 | -9999 | -9999 | -9999 | -9999 | -9999 | -9999 | -9999 | -9999 |
| 1963 | -9999 | -9999 | -9999 | -9999 | -9999 | -9999 | -9999 | -9999 | -9999 | -9999 | -9999 | -9999 | -9999 |
| 1964 | -9999 | -9999 | -9999 | -9999 | -9999 | -9999 | -9999 | -9999 | -9999 | -9999 | -9999 | -9999 | -9999 |
| 1965 | 151 | 89 | 55 | 41 | 33 | 65 | 1252 | 1212 | 1861 | 256 | 77 | 53 | 428.75 |
| 1966 | 44 | 36 | 25 | 16 | 11 | 13 | 1200 | 3630 | 1652 | 184 | 84 | 64 | 579.92 |
| 1967 | 50 | 40 | 29 | 42 | 17 | 256 | 229 | 5188 | 5159 | 636 | 245 | 256 | 1012.25 |
| 1968 | 60 | 40 | 30 | 10 | 10 | 10 | 3020 | 2660 | 6900 | 2100 | 80 | 50 | 1247.5 |
| 1969 | 93 | 65 | 53 | 40 | 21 | 47 | 2215 | 9625 | 5483 | 605 | 266 | 1400 | 1659.42 |
| 1970 | 125 | 110 | 80 | 58 | 29 | 1711 | 2326 | 4187 | 10505 | 1161 | 364 | 190 | 1737.17 |
| 1971 | 128 | 99 | 72 | 55 | 44 | 1358 | 4463 | 3443 | 4968 | 1808 | 417 | 210 | 1422.08 |
| 1972 | 145 | 93 | 69 | 43 | 38 | 107 | 1419 | 5977 | 4657 | 543 | 287 | 199 | 1131.42 |
| 1973 | 99 | 126 | 66 | 51 | 33 | 109 | 8063 | 7028 | 11037 | 2163 | 558 | 251 | 2465.33 |
| 1974 | 164 | 119 | 92 | 61 | 53 | 85 | 921 | 6972 | 958 | 665 | 300 | 170 | 880 |
| 1975 | -9999 | -9999 | -9999 | -9999 | -9999 | -9999 | -9999 | -9999 | -9999 | -9999 | -9999 | -9999 | -9999 |
| 1976 | 140 | 92 | 66 | 53 | 46 | 865 | 1923 | 5852 | 5045 | 513 | 229 | 130 | 1246.17 |
| 1977 | 100 | 77 | 63 | 46 | 41 | 932 | 2700 | 6589 | 6940 | 1418 | 381 | 476 | 1646.92 |
| 1978 | 157 | 166 | 121 | 81 | 53 | 276 | 3713 | 7395 | 3052 | 790 | 261 | 260 | 1360.42 |
| 1979 | 136 | 200 | 148 | 105 | 86 | 733 | 1186 | 5335 | 565 | 242 | 110 | 190 | 753 |
| |
|
|
|
|
|
|
|
|
|
|
|
|
|
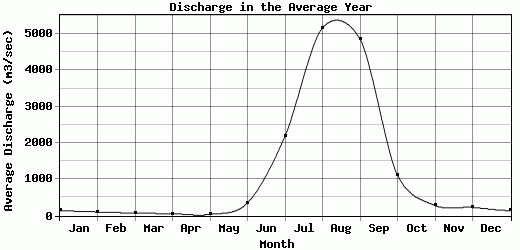
| Avg | 138.31 | 101.58 | 73.19 | 53.46 | 35.5 | 351.31 | 2188.85 | 5170.23 | 4857.62 | 1114.19 | 283.65 | 226.65 | 1216.21 |
| |
|
|
|
|
|
|
|
|
|
|
|
|
|
| Std Dev | 76.06 |
54.28 |
36.65 |
29.46 |
20.36 |
422.86 |
1665.51 |
1963.44 |
3206.45 |
819.53 |
186.81 |
254.96 |
454.22 |
| |
|
|
|
|
|
|
|
|
|
|
|
|
|
| | Jan | Feb | Mar | Apr | May | Jun | Jul | Aug | Sep | Oct | Nov | Dec | Avg Annual |
Click here for this table in tab-delimited format.
Tab-delimited format will open in most table browsing software, i.e. Excel, etc.
View this station on the map.
Return to start.