Results
| Country: | Canada
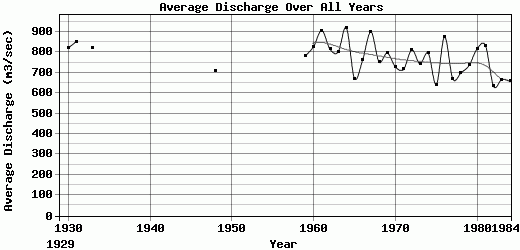
| | Station: | ShumelCreek | | River: | Nass | | Area: | 19200 km2 | | Lat: | 55.25 | | Lon: | -129.08 | | Source: | RivDIS | | PointID: | 265 | | Area Units: | km2 | | Discharge Units: | m3/sec | | Starting Year: | 1929 | | Ending Year: | 1984 | | Total Years: | 56 | | Total Usable Years: | 45 | |
| |
| Year | Jan | Feb | Mar | Apr | May | Jun | Jul | Aug | Sep | Oct | Nov | Dec | Avg Annual |
|---|
| 1929 | -9999 | -9999 | -9999 | -9999 | -9999 | -9999 | 1460 | 1330 | 865 | 958 | 719 | 359 | -9999 |
| 1930 | 293 | 141 | 139 | 407 | 1020 | 2150 | 1700 | 1320 | 803 | 748 | 645 | 475 | 820.08 |
| 1931 | 214 | 205 | 127 | 357 | 1160 | 2440 | 2090 | 1420 | 854 | 693 | 432 | 239 | 852.58 |
| 1932 | -9999 | -9999 | -9999 | 468 | 1380 | 1930 | 1880 | 1560 | 1360 | 889 | 392 | 263 | -9999 |
| 1933 | 179 | 184 | 116 | 260 | 1300 | 1610 | 1580 | 1730 | 664 | 617 | 1250 | 379 | 822.42 |
| 1934 | 240 | -9999 | 196 | 799 | 1710 | 2000 | 1940 | 1370 | 784 | 835 | 422 | 239 | -9999 |
| 1935 | -9999 | -9999 | -9999 | 122 | 773 | 1590 | 1700 | 1010 | 692 | 707 | 360 | 353 | -9999 |
| 1936 | 133 | -9999 | -9999 | 363 | 1620 | 2840 | 1650 | 1340 | 951 | 1270 | 1200 | 379 | -9999 |
| 1937 | -9999 | -9999 | -9999 | 268 | 810 | 2410 | 1520 | 1180 | 951 | 855 | 350 | -9999 | -9999 |
| 1938 | -9999 | -9999 | -9999 | 427 | 1180 | 1750 | 1730 | 1010 | 1060 | 615 | 262 | 171 | -9999 |
| 1939 | -9999 | -9999 | -9999 | 276 | 1310 | 2180 | 1930 | 1300 | 1100 | 1320 | 881 | 423 | -9999 |
| 1940 | -9999 | -9999 | -9999 | 547 | 1160 | 1750 | 1990 | 1540 | 883 | 840 | 245 | 158 | -9999 |
| 1941 | -9999 | -9999 | -9999 | 640 | 1100 | 2050 | 1480 | 1010 | 638 | 806 | 592 | -9999 | -9999 |
| 1942 | -9999 | -9999 | -9999 | 309 | 1820 | 1970 | 1390 | 1150 | 745 | 709 | 396 | -9999 | -9999 |
| 1943 | -9999 | -9999 | -9999 | -9999 | 1040 | 2180 | 1750 | 1140 | 776 | 750 | 508 | 229 | -9999 |
| 1944 | -9999 | -9999 | -9999 | 375 | 1110 | 2120 | 1540 | 1280 | 724 | 1040 | 573 | -9999 | -9999 |
| 1945 | -9999 | -9999 | -9999 | 86.6 | 1360 | 1480 | 1280 | 986 | 534 | -9999 | -9999 | -9999 | -9999 |
| 1946 | -9999 | -9999 | -9999 | -9999 | -9999 | -9999 | -9999 | 1190 | 844 | 508 | 293 | 199 | -9999 |
| 1947 | -9999 | -9999 | -9999 | 480 | 1460 | 1840 | 1380 | 968 | 1090 | 714 | 245 | 121 | -9999 |
| 1948 | 124 | 71.5 | 56.7 | 76.5 | 1490 | 2280 | 1210 | 1070 | 1080 | 582 | 300 | 163 | 708.64 |
| 1949 | 117 | 77.2 | 153 | 367 | 1360 | 1670 | 1610 | 1260 | 1040 | -9999 | -9999 | -9999 | -9999 |
| 1950 | -9999 | -9999 | -9999 | -9999 | -9999 | -9999 | -9999 | -9999 | -9999 | -9999 | -9999 | -9999 | -9999 |
| 1951 | -9999 | -9999 | -9999 | -9999 | -9999 | -9999 | -9999 | -9999 | -9999 | -9999 | -9999 | -9999 | -9999 |
| 1952 | -9999 | -9999 | -9999 | -9999 | -9999 | -9999 | -9999 | -9999 | -9999 | -9999 | -9999 | -9999 | -9999 |
| 1953 | -9999 | -9999 | -9999 | -9999 | -9999 | -9999 | -9999 | -9999 | -9999 | -9999 | -9999 | -9999 | -9999 |
| 1954 | -9999 | -9999 | -9999 | -9999 | -9999 | -9999 | -9999 | -9999 | -9999 | -9999 | -9999 | -9999 | -9999 |
| 1955 | -9999 | -9999 | -9999 | -9999 | -9999 | -9999 | -9999 | -9999 | -9999 | -9999 | -9999 | -9999 | -9999 |
| 1956 | -9999 | -9999 | -9999 | -9999 | -9999 | 1390 | 1640 | 1290 | 779 | 571 | 308 | 246 | -9999 |
| 1957 | 206 | 113 | 82.4 | 230 | 1830 | 2290 | 1460 | 1210 | 825 | 495 | 483 | -9999 | -9999 |
| 1958 | -9999 | -9999 | -9999 | -9999 | 1760 | 2420 | 1410 | 1130 | 647 | 1000 | 554 | 147 | -9999 |
| 1959 | 124 | 93 | 152 | 320 | 1180 | 2210 | 1940 | 980 | 831 | 730 | 384 | 450 | 782.83 |
| 1960 | 116 | 121 | 152 | 465 | 1410 | 1840 | 2320 | 1370 | 653 | 943 | 400 | 145 | 827.92 |
| 1961 | 123 | 119 | 123 | 430 | 1390 | 2320 | 1690 | 1190 | 852 | 1970 | 512 | 168 | 907.25 |
| 1962 | 155 | 271 | 114 | 280 | 1070 | 2040 | 2170 | 1350 | 698 | 576 | 728 | 326 | 814.83 |
| 1963 | 431 | 335 | 206 | 299 | 1190 | 1570 | 2060 | 1200 | 1040 | 847 | 280 | 167 | 802.08 |
| 1964 | 151 | 125 | 635 | 275 | 796 | 3100 | 2160 | 1290 | 613 | 1310 | 373 | 208 | 919.67 |
| 1965 | 186 | 181 | 165 | 275 | 861 | 1810 | 1800 | 1160 | 508 | 653 | 296 | 154 | 670.75 |
| 1966 | 126 | 96 | 121 | 413 | 900 | 2030 | 1930 | 1170 | 980 | 841 | 388 | 159 | 762.83 |
| 1967 | 122 | 123 | 93 | 138 | 1300 | 3000 | 1380 | 1360 | 1700 | 1040 | 343 | 204 | 900.25 |
| 1968 | 195 | 252 | 223 | 230 | 1350 | 1730 | 1810 | 917 | 1110 | 639 | 376 | 202 | 752.83 |
| 1969 | 87 | 64.6 | 55.3 | 223 | 1230 | 2620 | 1150 | 1200 | 952 | 543 | 898 | 536 | 796.58 |
| 1970 | 132 | 130 | 142 | 213 | 846 | 2390 | 1660 | 1380 | 761 | 689 | 324 | 75.7 | 728.56 |
| 1971 | 76.5 | 66.1 | 61.9 | 149 | 794 | 2400 | 1630 | 1340 | 948 | 723 | 302 | 104 | 716.21 |
| 1972 | 46.2 | 42.2 | 60.1 | 142 | 1320 | 2460 | 2090 | 1420 | 691 | 951 | 406 | 114 | 811.88 |
| 1973 | 80.2 | 82.8 | 92 | 265 | 1340 | 2090 | 1860 | 1130 | 1140 | 459 | 230 | 150 | 743.25 |
| 1974 | 51.5 | 44.9 | 50.6 | 222 | 943 | 1570 | 1650 | 1260 | 968 | 2240 | 371 | 183 | 796.17 |
| 1975 | 112 | 80.1 | 68.4 | 201 | 1090 | 1830 | 2000 | 954 | 647 | 446 | 189 | 86.6 | 642.01 |
| 1976 | 130 | 103 | 87 | 228 | 1270 | 2060 | 2460 | 1590 | 886 | 798 | 689 | 194 | 874.58 |
| 1977 | 117 | 151 | 127 | 468 | 1130 | 1870 | 1450 | 1290 | 507 | 632 | 237 | 73.1 | 671.01 |
| 1978 | 61 | 70 | 80 | 319 | 887 | 1800 | 1230 | 1140 | 611 | 1230 | 826 | 127 | 698.42 |
| 1979 | 93.5 | 79 | 120 | 378 | 1380 | 1810 | 1680 | 1110 | 890 | 857 | 214 | 218 | 735.79 |
| 1980 | 142 | 67.5 | 72 | 337 | 1370 | 1990 | 1360 | 1000 | 811 | 1510 | 910 | 245 | 817.88 |
| 1981 | 264 | 176 | 161 | 261 | 1800 | 1760 | 1780 | 1170 | 1210 | 639 | 579 | 192 | 832.67 |
| 1982 | 115 | 102 | 87.3 | 153 | 813 | 2420 | 1400 | 817 | 723 | 661 | 215 | 86.7 | 632.75 |
| 1983 | 98.7 | 111 | 136 | 375 | 1290 | 1870 | 1250 | 1070 | 817 | 539 | 342 | 106 | 667.06 |
| 1984 | 98.7 | 126 | 182 | 332 | 914 | 1700 | 1590 | 1300 | 642 | 681 | 200 | 126 | 657.64 |
| |
|
|
|
|
|
|
|
|
|
|
|
|
|
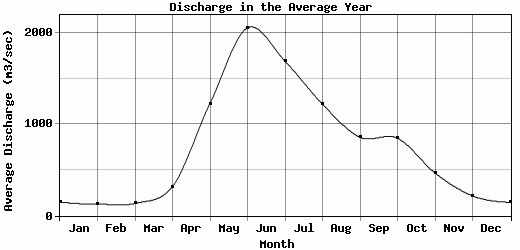
| Avg | 145.3 | 125.12 | 134.45 | 316.65 | 1225.89 | 2054.79 | 1690.2 | 1219.04 | 857.56 | 847.27 | 467.13 | 217.28 | 772.25 |
| |
|
|
|
|
|
|
|
|
|
|
|
|
|
| Std Dev | 75.3 |
65.95 |
99.35 |
140.91 |
285.89 |
377.5 |
298.84 |
182.9 |
221.93 |
353.29 |
247.28 |
112.82 |
79.75 |
| |
|
|
|
|
|
|
|
|
|
|
|
|
|
| | Jan | Feb | Mar | Apr | May | Jun | Jul | Aug | Sep | Oct | Nov | Dec | Avg Annual |
Click here for this table in tab-delimited format.
Tab-delimited format will open in most table browsing software, i.e. Excel, etc.
View this station on the map.
Return to start.