Results
| Country: | U.S.A.
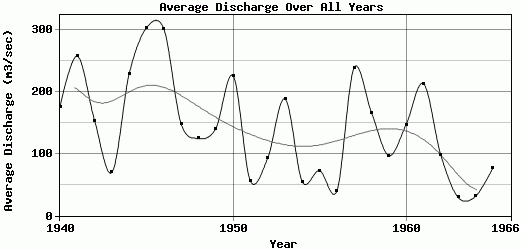
| | Station: | EVADALE, TEX. | | River: | NECHES RIVER | | Area: | 20591.87 | | Lat: | 30.35 | | Lon: | -94.09 | | Source: | USGS | | PointID: | 8041000 | | Area Units: | km2 | | Discharge Units: | m3/sec | | Starting Year: | 1940 | | Ending Year: | 1966 | | Total Years: | 27 | | Total Usable Years: | 26 | |
| |
| Year | Jan | Feb | Mar | Apr | May | Jun | Jul | Aug | Sep | Oct | Nov | Dec | Avg Annual |
|---|
| 1940 | 66.27 | 325.17 | 48.39 | 150.1 | 126.74 | 180.6 | 82.95 | 32.87 | 42.97 | 7.49 | 272.34 | 768.03 | 175.33 |
| 1941 | 560.48 | 252.72 | 369.42 | 151.86 | 374.96 | 388.31 | 276.7 | 30.77 | 36.14 | 73.5 | 363.44 | 208.14 | 257.2 |
| 1942 | 136.16 | 144.63 | 223.44 | 331.7 | 515.64 | 251.31 | 37.34 | 47.08 | 79.82 | 15.18 | 27.21 | 31.43 | 153.41 |
| 1943 | 123.14 | 51.38 | 59.83 | 93.76 | 48.44 | 267.07 | 119.64 | 6.04 | 3.49 | 25.03 | 12.67 | 26.77 | 69.77 |
| 1944 | 218.58 | 233.37 | 390.32 | 361.44 | 929.25 | 352.76 | 15.47 | 6.59 | 26.81 | 5.14 | 32.69 | 173.24 | 228.8 |
| 1945 | 608.54 | 275.43 | 553.46 | 1230.47 | 130.74 | 100.4 | 319.95 | 50.13 | 12.77 | 152.17 | 71.06 | 128.92 | 302.84 |
| 1946 | 518.64 | 657.76 | 479.56 | 264.22 | 335.17 | 642.89 | 60.46 | 18.11 | 28.5 | 19.64 | 288.75 | 298.98 | 301.06 |
| 1947 | 469.4 | 204.19 | 309.62 | 315.01 | 176.63 | 45.89 | 25.48 | 5.46 | 17.19 | 6.7 | 35.3 | 164.73 | 147.97 |
| 1948 | 214.67 | 423.33 | 323.58 | 182.41 | 185.11 | 98.51 | 16.19 | 6.64 | 3.58 | 3.12 | 14.44 | 21.13 | 124.39 |
| 1949 | 182.34 | 274.65 | 311.61 | 194.75 | 113.84 | 64.44 | 53.6 | 54.42 | 19.78 | 169.96 | 119.06 | 125.18 | 140.3 |
| 1950 | 523.57 | 577.67 | 424.8 | 90.8 | 440.92 | 455.35 | 54.38 | 51.31 | 32.3 | 19.96 | 16.64 | 18.71 | 225.53 |
| 1951 | 60.3 | 144.6 | 161.42 | 105.76 | 54.52 | 53.11 | 26.97 | 4.32 | 7.38 | 3.68 | 7.83 | 41.64 | 55.96 |
| 1952 | 48.46 | 212.56 | 175.99 | 251.95 | 212.33 | 125.9 | 12.76 | 5.66 | 1.93 | 1.56 | 4.26 | 55.91 | 92.44 |
| 1953 | 81.52 | 176.49 | 405.96 | 103.91 | 1053.76 | 273.35 | 40.51 | 26.55 | 16.21 | 3.97 | 9.93 | 68.82 | 188.42 |
| 1954 | 97.36 | 104.35 | 41.37 | 75.53 | 203.7 | 28.4 | 3.53 | 1.76 | 1.04 | 2.16 | 68.84 | 29.33 | 54.78 |
| 1955 | 50.8 | 141.12 | 124.6 | 263.77 | 112.65 | 30.1 | 19.47 | 91.53 | 15.31 | 9.23 | 3.82 | 8.41 | 72.57 |
| 1956 | 13.38 | 131.6 | 49.09 | 94.75 | 165.33 | 8.29 | 3.32 | 1.44 | 1.04 | 0.91 | 5.82 | 3.47 | 39.87 |
| 1957 | 8.85 | 79.2 | 92.77 | 298.37 | 1070.29 | 494.23 | 48.62 | 10.46 | 6.82 | 105.03 | 386.99 | 263.51 | 238.76 |
| 1958 | 259.11 | 187.7 | 167.39 | 121.67 | 694.6 | 107 | 63.32 | 24.26 | 225.59 | 74.23 | 35.62 | 32.56 | 166.09 |
| 1959 | 27.12 | 150.86 | 147.18 | 220.51 | 201.12 | 73.69 | 25.34 | 35.21 | 11.1 | 64.99 | 45.54 | 158.95 | 96.8 |
| 1960 | 349.54 | 318.89 | 316.79 | 64.15 | 54.77 | 35.37 | 43.55 | 20.56 | 21.18 | 32.93 | 77.78 | 425.15 | 146.72 |
| 1961 | 564.06 | 341.51 | 398.91 | 320.58 | 36.96 | 103.5 | 113.01 | 24.3 | 107.6 | 19.58 | 63.19 | 461.11 | 212.86 |
| 1962 | 224.38 | 210.03 | 189.97 | 133.82 | 223.17 | 45.61 | 21.18 | 10.49 | 24.43 | 15.76 | 16.52 | 59.44 | 97.9 |
| 1963 | 52.18 | 48.67 | 45.38 | 45.15 | 110.69 | 17.26 | 9.52 | 5.5 | 3.62 | 2.2 | 3.96 | 10.96 | 29.59 |
| 1964 | 22.89 | 25.05 | 107.81 | 108.75 | 55.99 | 19.1 | 2.62 | 4.4 | 2.98 | 4.88 | 3.28 | 12.39 | 30.85 |
| 1965 | 24.75 | 126.58 | 125.54 | 154.85 | 162.56 | 243.38 | 14.31 | 4.45 | 14.24 | 5.79 | 4.22 | 32.16 | 76.07 |
| 1966 | -9999 | -9999 | -9999 | -9999 | -9999 | -9999 | -9999 | -9999 | -9999 | -9999 | -9999 | -9999 | -9999 |
| |
|
|
|
|
|
|
|
|
|
|
|
|
|
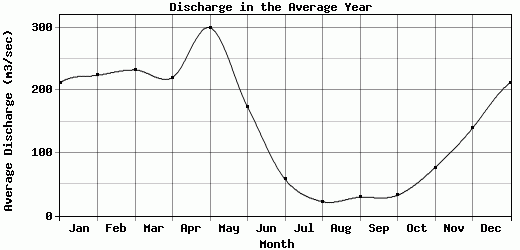
| Avg | 211.79 | 223.83 | 232.47 | 220.39 | 299.61 | 173.3 | 58.08 | 22.32 | 29.38 | 32.49 | 76.58 | 139.58 | 143.32 |
| |
|
|
|
|
|
|
|
|
|
|
|
|
|
| Std Dev | 199.45 |
148.67 |
149.2 |
221.84 |
301.35 |
168.52 |
75.91 |
21.62 |
45.99 |
45.76 |
112.4 |
176.78 |
80.6 |
| |
|
|
|
|
|
|
|
|
|
|
|
|
|
| | Jan | Feb | Mar | Apr | May | Jun | Jul | Aug | Sep | Oct | Nov | Dec | Avg Annual |
Click here for this table in tab-delimited format.
Tab-delimited format will open in most table browsing software, i.e. Excel, etc.
View this station on the map.
Return to start.