Results
| Country: | Mali
| | Station: | Ansongo | | River: | Niger | | Area: | 566000 km2 | | Lat: | 15.67 | | Lon: | 0.5 | | Source: | RivDIS | | PointID: | 1508 | | Area Units: | km2 | | Discharge Units: | m3/sec | | Starting Year: | 1957 | | Ending Year: | 1987 | | Total Years: | 31 | | Total Usable Years: | 22 | |
| |
| Year | Jan | Feb | Mar | Apr | May | Jun | Jul | Aug | Sep | Oct | Nov | Dec | Avg Annual |
|---|
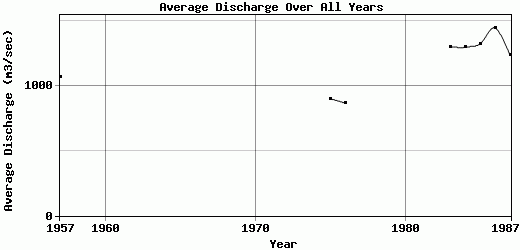
| 1957 | 1911 | 1828 | 1444 | 608 | 172 | 54.1 | 103 | 605 | 1157 | 1426 | 1659 | 1847 | 1067.84 |
| 1958 | 2059 | 2144 | 1998 | 1604 | 649 | -9999 | -9999 | 937 | 1266 | 1505 | 1729 | 1897 | -9999 |
| 1959 | 1985 | 1982 | 1823 | -9999 | -9999 | -9999 | -9999 | 559 | 1123 | 1416 | 1665 | 1859 | -9999 |
| 1960 | 1983 | 1913 | 1481 | 687 | 170 | 50.6 | 120 | -9999 | -9999 | -9999 | -9999 | -9999 | -9999 |
| 1961 | 1958 | 1898 | 1554 | 815 | -9999 | -9999 | -9999 | 161 | 976 | 1415 | 1586 | 1785 | -9999 |
| 1962 | 1890 | 1783 | 1485 | 786 | -9999 | -9999 | -9999 | 131 | 1091 | 1389 | -9999 | -9999 | -9999 |
| 1963 | 2017 | 2026 | 1652 | 1102 | -9999 | -9999 | -9999 | -9999 | 933 | 1277 | 1466 | 1693 | -9999 |
| 1964 | 1871 | 1872 | 1490 | 618 | -9999 | -9999 | -9999 | 627 | 1134 | 1424 | 1693 | 1922 | -9999 |
| 1965 | 2129 | 2129 | 1853 | 1039 | -9999 | -9999 | -9999 | 761 | 1329 | 1570 | 1742 | -9999 | -9999 |
| 1966 | 2009 | 1987 | 1404 | 496 | -9999 | -9999 | -9999 | -9999 | 770 | 1255 | 1537 | 1777 | -9999 |
| 1967 | -9999 | -9999 | 1229 | 545 | -9999 | -9999 | -9999 | -9999 | -9999 | 1467 | 1734 | 1971 | -9999 |
| 1968 | 2182 | 2132 | 1813 | 1042 | -9999 | -9999 | -9999 | 708 | 1162 | 1402 | 1643 | 1834 | -9999 |
| 1969 | -9999 | 1685 | 975 | -9999 | -9999 | -9999 | -9999 | 645 | 1221 | 1537 | 1824 | 2019 | -9999 |
| 1970 | -9999 | -9999 | -9999 | 933 | -9999 | -9999 | -9999 | 408 | 1078 | 1702 | 1927 | -9999 | -9999 |
| 1971 | -9999 | -9999 | -9999 | -9999 | -9999 | -9999 | -9999 | -9999 | 1222 | 1531 | 1647 | -9999 | -9999 |
| 1972 | -9999 | -9999 | 1234 | 531 | 106 | 55 | -9999 | 263 | 425 | 937 | 1573 | -9999 | -9999 |
| 1973 | 1515 | 914 | -9999 | -9999 | -9999 | 78.2 | 147 | 308 | 888 | 1440 | 1483 | 1266 | -9999 |
| 1974 | -9999 | 369 | -9999 | -9999 | -9999 | -9999 | -9999 | -9999 | 1131 | 1478 | 1715 | 1882 | -9999 |
| 1975 | 1811 | 1227 | 395 | 102 | 17.6 | 6.09 | 21.3 | 510 | 1158 | 1794 | 1772 | 1985 | 899.92 |
| 1976 | 1999 | 1531 | 664 | 189 | 46.5 | 12.7 | 31.9 | 410 | 951 | 1332 | 1540 | 1694 | 866.76 |
| 1977 | 1727 | 1398 | 1058 | 495 | 91.7 | -9999 | -9999 | -9999 | -9999 | 1125 | 1377 | 1483 | -9999 |
| 1978 | 860 | 375 | 180 | 57.9 | 14.6 | 3.69 | -9999 | 656 | 1069 | 1354 | 1595 | 1792 | -9999 |
| 1979 | -9999 | 1298 | 459 | -9999 | -9999 | -9999 | 73.8 | -9999 | -9999 | -9999 | -9999 | 1890 | -9999 |
| 1980 | 1966 | 331 | -9999 | -9999 | -9999 | -9999 | -9999 | -9999 | -9999 | -9999 | -9999 | -9999 | -9999 |
| 1981 | -9999 | -9999 | -9999 | -9999 | -9999 | -9999 | -9999 | -9999 | -9999 | -9999 | 1651 | 1844 | -9999 |
| 1982 | 1950 | 1950 | 1865 | 1062 | -9999 | -9999 | 267 | 664 | 1087 | 1375 | 1617 | 1798 | -9999 |
| 1983 | 1989 | 2099 | 2021 | 1604 | 858 | 225 | 77.8 | 485 | 1143 | 1492 | 1720 | 1903 | 1301.4 |
| 1984 | 2087 | 2108 | 1911 | 1316 | 505 | 77.5 | 184 | 875 | 1271 | 1519 | 1755 | 1935 | 1295.29 |
| 1985 | 2070 | 2075 | 1920 | 1321 | 540 | 214 | 336 | 841 | 1261 | 1522 | 1754 | 1984 | 1319.83 |
| 1986 | 2185 | 2259 | 2123 | 1688 | 910 | 326 | 328 | 884 | 1278 | 1560 | 1796 | 1994 | 1444.25 |
| 1987 | 2175 | 2203 | 1965 | 1448 | 633 | 212 | 135 | 452 | 936 | 1309 | 1569 | 1772 | 1234.08 |
| |
|
|
|
|
|
|
|
|
|
|
|
|
|
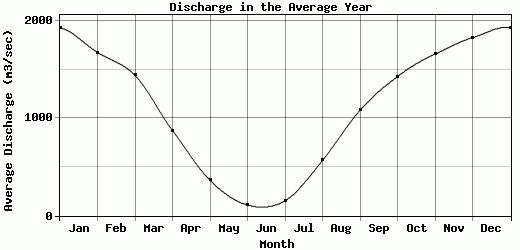
| Avg | 1927.3 | 1673.69 | 1439.84 | 873.43 | 362.57 | 109.57 | 152.07 | 566.19 | 1082.4 | 1427.89 | 1658.11 | 1826.08 | 1178.67 |
| |
|
|
|
|
|
|
|
|
|
|
|
|
|
| Std Dev | 271.64 |
574.26 |
538.11 |
467.44 |
316.79 |
101.82 |
102.45 |
226.87 |
190.48 |
163.33 |
118.35 |
164.98 |
196.68 |
| |
|
|
|
|
|
|
|
|
|
|
|
|
|
| | Jan | Feb | Mar | Apr | May | Jun | Jul | Aug | Sep | Oct | Nov | Dec | Avg Annual |
Click here for this table in tab-delimited format.
Tab-delimited format will open in most table browsing software, i.e. Excel, etc.
View this station on the map.
Return to start.