Results
| Country: | Mali
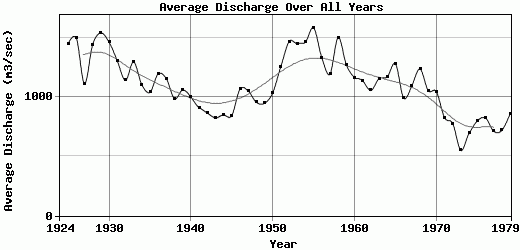
| | Station: | Dire | | River: | Niger | | Area: | 340000 km2 | | Lat: | 16.26 | | Lon: | -3.38 | | Source: | RivDIS | | PointID: | 64 | | Area Units: | km2 | | Discharge Units: | m3/sec | | Starting Year: | 1924 | | Ending Year: | 1979 | | Total Years: | 56 | | Total Usable Years: | 55 | |
| |
| Year | Jan | Feb | Mar | Apr | May | Jun | Jul | Aug | Sep | Oct | Nov | Dec | Avg Annual |
|---|
| 1924 | -9999 | -9999 | -9999 | -9999 | -9999 | -9999 | 255 | 1038 | 1691 | 2096 | 2397 | 2584 | -9999 |
| 1925 | 2486 | 2135 | 1505 | 819 | 293 | 118 | 379 | 1021 | 1678 | 2076 | 2309 | 2557 | 1448 |
| 1926 | 2658 | 2335 | 1744 | 1048 | 425 | 147 | 470 | 1113 | 1634 | 1945 | 2185 | 2245 | 1495.75 |
| 1927 | 1755 | 1182 | 634 | 208 | 78 | 73 | 273 | 912 | 1540 | 1949 | 2242 | 2483 | 1110.75 |
| 1928 | 2535 | 2149 | 1567 | 877 | 314 | 152 | 302 | 864 | 1588 | 2022 | 2328 | 2599 | 1441.42 |
| 1929 | 2523 | 2161 | 1538 | 853 | 321 | 161 | 590 | 1322 | 1835 | 2144 | 2393 | 2621 | 1538.5 |
| 1930 | 2614 | 2213 | 1574 | 890 | 333 | 155 | 541 | 1053 | 1596 | 1957 | 2201 | 2401 | 1460.67 |
| 1931 | 2263 | 1756 | 1149 | 572 | 193 | 214 | 522 | 1039 | 1568 | 1933 | 2177 | 2272 | 1304.83 |
| 1932 | 1948 | 1370 | 805 | 314 | 106 | 98 | 328 | 880 | 1463 | 1855 | 2154 | 2345 | 1138.83 |
| 1933 | 2271 | 1744 | 1138 | 567 | 179 | 77 | 377 | 1063 | 1594 | 1939 | 2223 | 2362 | 1294.5 |
| 1934 | 2130 | 1583 | 1002 | 439 | 114 | 30 | 90 | 584 | 1291 | 1761 | 2044 | 2168 | 1103 |
| 1935 | 1767 | 1211 | 668 | 211 | 73 | 50 | 106 | 679 | 1410 | 1864 | 2144 | 2292 | 1039.58 |
| 1936 | 2010 | 1421 | 802 | 281 | 70 | 178 | 428 | 975 | 1586 | 1962 | 2218 | 2403 | 1194.5 |
| 1937 | 2284 | 1772 | 1167 | 552 | 164 | 64 | 121 | 595 | 1268 | 1726 | 1994 | 2137 | 1153.67 |
| 1938 | 1690 | 1104 | 560 | 175 | 57 | 50 | 115 | 555 | 1284 | 1805 | 2120 | 2305 | 985 |
| 1939 | 2065 | 1464 | 868 | 326 | 80 | 56 | 145 | 561 | 1226 | 1720 | 2003 | 2180 | 1057.83 |
| 1940 | 2012 | 1404 | 833 | 302 | 85 | 40 | 116 | 570 | 1176 | 1624 | 1870 | 1958 | 999.17 |
| 1941 | 1457 | 912 | 412 | 113 | 50 | 40 | 175 | 736 | 1312 | 1712 | 1973 | 2040 | 911 |
| 1942 | 1499 | 910 | 367 | 80 | 50 | 50 | 135 | 654 | 1309 | 1693 | 1898 | 1739 | 865.33 |
| 1943 | 1140 | 619 | 197 | 56 | 35 | 35 | 103 | 649 | 1277 | 1748 | 2025 | 2001 | 823.75 |
| 1944 | 1510 | 1050 | 530 | 170 | 50 | 40 | 58 | 368 | 1102 | 1605 | 1867 | 1829 | 848.25 |
| 1945 | 1184 | 624 | 185 | 50 | 30 | 20 | 52 | 503 | 1375 | 1812 | 2074 | 2209 | 843.17 |
| 1946 | 1926 | 1273 | 644 | 153 | 50 | 50 | 188 | 802 | 1450 | 1856 | 2119 | 2281 | 1066 |
| 1947 | 2118 | 1541 | 910 | 295 | 64 | 40 | 97 | 655 | 1277 | 1676 | 1940 | 1996 | 1050.75 |
| 1948 | 1357 | 745 | 286 | 58 | 40 | 30 | 269 | 992 | 1540 | 1877 | 2104 | 2158 | 954.67 |
| 1949 | 1550 | 1100 | 550 | 170 | 55 | 50 | 58 | 535 | 1326 | 1783 | 2141 | 2043 | 946.75 |
| 1950 | 1487 | 1096 | 686 | 207 | 85 | 56 | 74 | 718 | 1494 | 1950 | 2188 | 2370 | 1034.25 |
| 1951 | 2222 | 1684 | 1018 | 372 | 87 | 129 | 423 | 971 | 1588 | 1946 | 2211 | 2430 | 1256.75 |
| 1952 | 2534 | 2279 | 1717 | 1002 | 351 | 86 | 177 | 921 | 1688 | 2070 | 2284 | 2474 | 1465.25 |
| 1953 | 2431 | 1981 | 1360 | 684 | 167 | 79 | 571 | 1338 | 1767 | 2114 | 2366 | 2551 | 1450.75 |
| 1954 | 2455 | 1985 | 1359 | 696 | 238 | 169 | 593 | 1236 | 1769 | 2102 | 2363 | 2570 | 1461.25 |
| 1955 | 2582 | 2242 | 1677 | 980 | 431 | 195 | 640 | 1319 | 1796 | 2138 | 2391 | 2589 | 1581.67 |
| 1956 | 2550 | 2106 | 1442 | 799 | 276 | 89 | 186 | 786 | 1433 | 1870 | 2136 | 2276 | 1329.08 |
| 1957 | 1931 | 1384 | 781 | 252 | 66 | 50 | 293 | 1032 | 1684 | 2034 | 2285 | 2519 | 1192.58 |
| 1958 | 2579 | 2211 | 1647 | 900 | 331 | 230 | 675 | 1222 | 1648 | 1986 | 2207 | 2381 | 1501.42 |
| 1959 | 2225 | 1791 | 1267 | 608 | 140 | 50 | 241 | 912 | 1546 | 1950 | 2197 | 2315 | 1270.17 |
| 1960 | 1958 | 1438 | 786 | 237 | 52 | 38 | 300 | 1036 | 1620 | 1980 | 2200 | 2317 | 1163.5 |
| 1961 | 2055 | 1562 | 944 | 342 | 64 | 35 | 95 | 845 | 1549 | 1905 | 2148 | 2098 | 1136.83 |
| 1962 | 1690 | 1121 | 517 | 136 | 40 | 30 | 185 | 880 | 1546 | 1930 | 2206 | 2391 | 1056 |
| 1963 | 2186 | 1762 | 1142 | 513 | 110 | 60 | 87 | 634 | 1357 | 1767 | 2033 | 2203 | 1154.5 |
| 1964 | 1897 | 1464 | 820 | 238 | 63 | 37 | 324 | 958 | 1620 | 2022 | 2258 | 2343 | 1170.33 |
| 1965 | 2147 | 1764 | 1166 | 504 | 166 | 45 | 348 | 1151 | 1723 | 2004 | 2185 | 2138 | 1278.42 |
| 1966 | 1860 | 1338 | 710 | 190 | 50 | 25 | 90 | 506 | 1234 | 1765 | 2014 | 2120 | 991.83 |
| 1967 | 1755 | 1339 | 718 | 201 | 50 | 30 | 115 | 806 | 1558 | 1949 | 2200 | 2382 | 1091.92 |
| 1968 | 2208 | 1774 | 1126 | 484 | 102 | 78 | 553 | 1030 | 1565 | 1896 | 2074 | 1939 | 1235.75 |
| 1969 | 1520 | 1003 | 457 | 96 | 36 | 26 | 242 | 1091 | 1664 | 1974 | 2185 | 2346 | 1053.33 |
| 1970 | 2072 | 1590 | 929 | 308 | 75 | 35 | 85 | 586 | 1334 | 1713 | 2014 | 1787 | 1044 |
| 1971 | 1262 | 715 | 243 | 61 | 31 | 26 | 65 | 686 | 1355 | 1803 | 2038 | 1624 | 825.75 |
| 1972 | 1194 | 612 | 172 | 44 | 26 | 55 | 469 | 900 | 1377 | 1658 | 1598 | 1206 | 775.92 |
| 1973 | 743 | 273 | 98 | 25 | 10 | 5 | 103 | 368 | 1170 | 1410 | 1370 | 1020 | 549.58 |
| 1974 | 508 | 153 | 85 | 20 | 15 | 10 | 200 | 736 | 1450 | 1700 | 1780 | 1660 | 693.08 |
| 1975 | 1110 | 503 | 122 | 31 | 14.5 | 15 | 162 | 805 | 1460 | 1740 | 1840 | 1770 | 797.71 |
| 1976 | 1390 | 708 | 219 | 72.5 | 46.5 | 36.5 | 215 | 707 | 1280 | 1570 | 1720 | 1920 | 823.71 |
| 1977 | 1660 | 1090 | 443 | 110 | 58.5 | 35.5 | 120 | 508 | 1000 | 1020 | 1440 | 1060 | 712.08 |
| 1978 | 537 | 180 | 78 | 48.5 | 35 | 36.5 | 390 | 841 | 1340 | 1640 | 1810 | 1670 | 717.17 |
| 1979 | 1154 | 590 | 319 | 48.5 | 18 | 136 | 254 | 898 | 1543 | 1902 | 1857 | 1532 | 854.29 |
| |
|
|
|
|
|
|
|
|
|
|
|
|
|
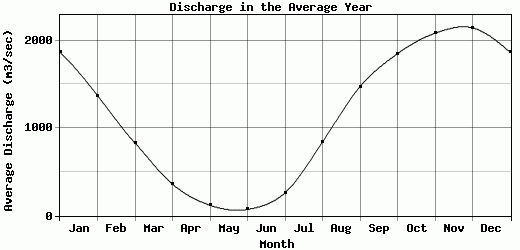
| Avg | 1866.44 | 1373.02 | 830.6 | 359.79 | 118.97 | 71.74 | 260.14 | 841.88 | 1474.18 | 1850.86 | 2084.66 | 2146.59 | 1104.45 |
| |
|
|
|
|
|
|
|
|
|
|
|
|
|
| Std Dev | 532.47 |
571.03 |
481.34 |
300.41 |
110.91 |
54.91 |
173.96 |
239.76 |
187.17 |
193.53 |
218.19 |
369.39 |
246.35 |
| |
|
|
|
|
|
|
|
|
|
|
|
|
|
| | Jan | Feb | Mar | Apr | May | Jun | Jul | Aug | Sep | Oct | Nov | Dec | Avg Annual |
Click here for this table in tab-delimited format.
Tab-delimited format will open in most table browsing software, i.e. Excel, etc.
View this station on the map.
Return to start.