Results
| Country: | Mali
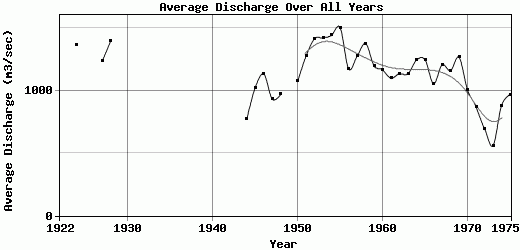
| | Station: | Mopti- Nantaka | | River: | Niger | | Area: | 281600 km2 | | Lat: | 14.5 | | Lon: | -4.2 | | Source: | RivDIS | | PointID: | 63 | | Area Units: | km2 | | Discharge Units: | m3/sec | | Starting Year: | 1922 | | Ending Year: | 1975 | | Total Years: | 54 | | Total Usable Years: | 41 | |
| |
| Year | Jan | Feb | Mar | Apr | May | Jun | Jul | Aug | Sep | Oct | Nov | Dec | Avg Annual |
|---|
| 1922 | -9999 | -9999 | -9999 | -9999 | -9999 | 162 | 416 | 1247 | 2581 | 2948 | -9999 | -9999 | -9999 |
| 1923 | -9999 | -9999 | -9999 | -9999 | -9999 | -9999 | 622 | 1810 | 2550 | 2742 | 2571 | 1952 | -9999 |
| 1924 | 779 | 320 | 150 | 70 | 50 | 350 | 918 | 2300 | 2881 | 3064 | 2935 | 2546 | 1363.58 |
| 1925 | 1484 | 529 | 270 | 160 | 100 | -9999 | 792 | 1876 | 2754 | 3009 | 3041 | 2677 | -9999 |
| 1926 | 1813 | 722 | 285 | 120 | 80 | -9999 | 1151 | 2035 | 2566 | 2680 | 2241 | 1274 | -9999 |
| 1927 | 510 | 230 | 100 | 70 | 65 | 100 | 878 | 1820 | 2659 | 2939 | 2916 | 2557 | 1237 |
| 1928 | 1690 | 571 | 230 | 130 | 90 | 270 | 715 | 1775 | 2752 | 3031 | 2976 | 2542 | 1397.67 |
| 1929 | 1505 | 607 | 285 | 150 | 105 | -9999 | 1430 | 2372 | 2792 | -9999 | -9999 | -9999 | -9999 |
| 1930 | -9999 | -9999 | -9999 | -9999 | -9999 | -9999 | -9999 | -9999 | -9999 | -9999 | -9999 | -9999 | -9999 |
| 1931 | -9999 | -9999 | -9999 | -9999 | -9999 | -9999 | -9999 | -9999 | -9999 | -9999 | -9999 | -9999 | -9999 |
| 1932 | -9999 | -9999 | -9999 | -9999 | -9999 | -9999 | -9999 | -9999 | -9999 | -9999 | -9999 | -9999 | -9999 |
| 1933 | -9999 | -9999 | -9999 | -9999 | -9999 | -9999 | -9999 | -9999 | -9999 | -9999 | -9999 | -9999 | -9999 |
| 1934 | 1200 | -9999 | -9999 | -9999 | -9999 | -9999 | -9999 | 1631 | 2529 | 2696 | 2457 | 1580 | -9999 |
| 1935 | -9999 | -9999 | -9999 | -9999 | -9999 | 50 | 478 | 1726 | 2624 | 2809 | 2680 | 2122 | -9999 |
| 1936 | 998 | 263 | 154 | 95 | 70 | 279 | 941 | 2069 | 2776 | 2923 | 2834 | -9999 | -9999 |
| 1937 | -9999 | -9999 | -9999 | -9999 | -9999 | -9999 | -9999 | -9999 | -9999 | -9999 | -9999 | -9999 | -9999 |
| 1938 | -9999 | -9999 | -9999 | -9999 | -9999 | -9999 | -9999 | -9999 | -9999 | -9999 | -9999 | -9999 | -9999 |
| 1939 | -9999 | -9999 | -9999 | -9999 | -9999 | -9999 | -9999 | -9999 | -9999 | -9999 | -9999 | -9999 | -9999 |
| 1940 | -9999 | -9999 | -9999 | -9999 | -9999 | -9999 | -9999 | -9999 | -9999 | -9999 | -9999 | -9999 | -9999 |
| 1941 | -9999 | -9999 | -9999 | -9999 | -9999 | -9999 | -9999 | -9999 | -9999 | -9999 | -9999 | -9999 | -9999 |
| 1942 | -9999 | -9999 | -9999 | -9999 | -9999 | -9999 | -9999 | -9999 | -9999 | -9999 | -9999 | -9999 | -9999 |
| 1943 | -9999 | -9999 | -9999 | -9999 | -9999 | 80 | 386 | 1308 | 2293 | 2609 | 2619 | 1237 | -9999 |
| 1944 | 389 | 181 | 103 | 66 | 52 | 51 | 228 | 899 | 2094 | 2262 | 1998 | 900 | 768.58 |
| 1945 | 293 | 151 | 87 | 58 | 43 | 54 | 193 | 1441 | 2550 | 2796 | 2675 | 1932 | 1022.75 |
| 1946 | 622 | 262 | 125 | 72 | 77 | 150 | 499 | 1618 | 2556 | 2810 | 2727 | 2053 | 1130.92 |
| 1947 | 839 | 320 | 159 | 88 | 60 | 55 | 358 | 1372 | 2186 | 2556 | 2178 | 990 | 930.08 |
| 1948 | 279 | 143 | 94 | 58 | 46 | 88 | 758 | 1727 | 2453 | 2578 | 2202 | 1194 | 968.33 |
| 1949 | 391 | 195 | 111 | 88 | 67 | 67 | 98 | -9999 | -9999 | -9999 | -9999 | -9999 | -9999 |
| 1950 | 362 | 187 | 107 | 61 | 49 | 38 | 306 | 1482 | 2527 | 2818 | 2763 | 2167 | 1072.25 |
| 1951 | 933 | 343 | 171 | 103 | 73 | 317 | 678 | 1738 | 2535 | 2821 | 2900 | 2718 | 1277.5 |
| 1952 | 1997 | 888 | 336 | 162 | 95 | 105 | 514 | 1929 | 2657 | 2906 | 2895 | 2483 | 1413.92 |
| 1953 | 1467 | 526 | 234 | 133 | 87 | 236 | 1228 | 2167 | 2803 | 3030 | 2849 | 2289 | 1420.75 |
| 1954 | 1242 | 506 | 238 | 176 | 155 | 359 | 1043 | 2208 | 2809 | 3030 | 2951 | 2586 | 1441.92 |
| 1955 | 1767 | 750 | 328 | 208 | 161 | 290 | 1198 | 2146 | 2812 | 2993 | 2929 | 2418 | 1500 |
| 1956 | 1435 | 552 | 284 | 168 | 129 | 128 | 467 | 1386 | 2419 | 2748 | 2545 | 1796 | 1171.42 |
| 1957 | 707 | 278 | 155 | 95 | 81 | 118 | 723 | 1944 | 2680 | 2958 | 2991 | 2554 | 1273.67 |
| 1958 | 1587 | 685 | 270 | 135 | 145 | 384 | 1070 | 1686 | 2525 | 2950 | 2777 | 2285 | 1374.92 |
| 1959 | 1264 | 503 | 231 | 117 | 59 | 160 | 579 | 1627 | 2531 | 2808 | 2593 | 1869 | 1195.08 |
| 1960 | 671 | 275 | 127 | 70 | 51 | 110 | 777 | 1858 | 2596 | 2827 | 2627 | 1988 | 1164.75 |
| 1961 | 802 | 317 | 158 | 78 | 40 | 52 | 433 | 1853 | 2590 | 2831 | 2484 | 1536 | 1097.83 |
| 1962 | 451 | 205 | 106 | 60 | 41 | 109 | 583 | 1672 | 2461 | 2899 | 2782 | 2234 | 1133.58 |
| 1963 | 1108 | 433 | 225 | 103 | 91 | 94 | 335 | 1344 | 2374 | 2749 | 2713 | 2052 | 1135.08 |
| 1964 | 851 | 306 | 140 | 81 | 41 | 118 | 640 | 1962 | 2732 | 2988 | 2802 | 2258 | 1243.25 |
| 1965 | 1272 | 482 | 225 | 125 | 73 | 128 | 975 | 1966 | 2572 | 2795 | 2541 | 1781 | 1244.58 |
| 1966 | 673 | 291 | 134 | 68 | 43 | 33 | 340 | 1052 | 2388 | 2774 | 2588 | 2253 | 1053.08 |
| 1967 | 772 | 293 | 122 | 78 | 46 | 87 | 460 | 1633 | 2652 | 3030 | 2905 | 2381 | 1204.92 |
| 1968 | 1240 | 443 | 274 | 102 | 60 | 320 | 850 | 1736 | 2489 | 2757 | 2243 | 1385 | 1158.25 |
| 1969 | 501 | 231 | 110 | 45 | 32 | 90 | 781 | 1971 | 2673 | 3172 | 3216 | 2353 | 1264.58 |
| 1970 | 889 | 352 | 167 | 102 | 73 | 60 | 280 | 1312 | 2449 | 2997 | 2327 | 1034 | 1003.5 |
| 1971 | 334 | 156 | 100 | 70 | 40 | 25 | 338 | 1348 | 2502 | 2865 | 1977 | 669 | 868.67 |
| 1972 | 284 | 141 | 78 | 55 | 40 | 292 | 652 | 1263 | 1986 | 1918 | 1207 | 431 | 695.58 |
| 1973 | 213 | 105 | 32 | 18 | 10 | 5 | 173 | 991 | 2030 | 1880 | 882 | 356 | 557.92 |
| 1974 | 131 | 82 | 30 | 20 | 15 | 10 | 240 | 1680 | 2550 | 2830 | 2200 | 752 | 878.33 |
| 1975 | 298 | 107 | 49 | 35 | 30 | 58 | 457 | 1550 | 2480 | 2930 | 2540 | 1070 | 967 |
| |
|
|
|
|
|
|
|
|
|
|
|
|
|
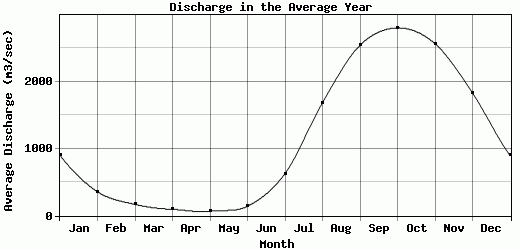
| Avg | 901.08 | 357.21 | 168.82 | 94.69 | 68.33 | 140.56 | 627.47 | 1686.74 | 2544.6 | 2803.71 | 2567.73 | 1831.35 | 1136.21 |
| |
|
|
|
|
|
|
|
|
|
|
|
|
|
| Std Dev | 507.8 |
197.33 |
81.37 |
43.19 |
34.8 |
107.9 |
316.69 |
342.67 |
200 |
259.11 |
451.14 |
663.87 |
217.23 |
| |
|
|
|
|
|
|
|
|
|
|
|
|
|
| | Jan | Feb | Mar | Apr | May | Jun | Jul | Aug | Sep | Oct | Nov | Dec | Avg Annual |
Click here for this table in tab-delimited format.
Tab-delimited format will open in most table browsing software, i.e. Excel, etc.
View this station on the map.
Return to start.