Results
| Country: | Canada
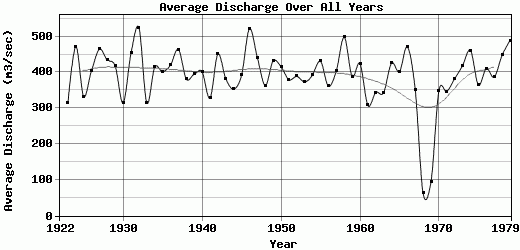
| | Station: | Centralede Chute-aux-Outardes | | River: | AuxOutardes | | Area: | 18900 km2 | | Lat: | 49.15 | | Lon: | -68.4 | | Source: | RivDIS | | PointID: | 319 | | Area Units: | km2 | | Discharge Units: | m3/sec | | Starting Year: | 1922 | | Ending Year: | 1979 | | Total Years: | 58 | | Total Usable Years: | 57 | |
| |
| Year | Jan | Feb | Mar | Apr | May | Jun | Jul | Aug | Sep | Oct | Nov | Dec | Avg Annual |
|---|
| 1922 | -9999 | -9999 | -9999 | -9999 | -9999 | -9999 | -9999 | -9999 | 368 | 359 | 260 | 194 | -9999 |
| 1923 | 143 | 114 | 104 | 73 | 1080 | 376 | 328 | 399 | 475 | 281 | 190 | 199 | 313.5 |
| 1924 | 920 | 55 | 72 | 75 | 889 | 951 | 710 | 538 | 526 | 413 | 250 | 261 | 471.67 |
| 1925 | 142 | 110 | 105 | 189 | 937 | 843 | 425 | 422 | 283 | 223 | 163 | 147 | 332.42 |
| 1926 | 99 | 70 | 57 | 60 | 727 | 1410 | 552 | 368 | 348 | 365 | 512 | 297 | 405.42 |
| 1927 | 220 | 138 | 115 | 192 | 886 | 1030 | 674 | 546 | 393 | 504 | 620 | 259 | 464.75 |
| 1928 | 212 | 155 | 123 | 168 | 1350 | 1080 | 560 | 362 | 399 | 362 | 268 | 176 | 434.58 |
| 1929 | 143 | 121 | 87 | 91 | 676 | 1440 | 628 | 558 | 425 | 402 | 308 | 125 | 417 |
| 1930 | 99 | 71 | 71 | 158 | 1050 | 705 | 425 | 368 | 283 | 212 | 178 | 156 | 314.67 |
| 1931 | 934 | 71 | 92 | 231 | 736 | 756 | 498 | 308 | 402 | 515 | 555 | 345 | 453.58 |
| 1932 | 219 | 150 | 136 | 207 | 1030 | 716 | 792 | 976 | 713 | 750 | 396 | 207 | 524.33 |
| 1933 | 144 | 132 | 115 | 186 | 889 | 985 | 365 | 205 | 178 | 238 | 190 | 146 | 314.42 |
| 1934 | 129 | 86 | 109 | 158 | 1040 | 993 | 574 | 467 | 351 | 396 | 425 | 245 | 414.42 |
| 1935 | 178 | 93 | 93 | 234 | 917 | 991 | 637 | 416 | 291 | 433 | 399 | 141 | 401.92 |
| 1936 | 112 | 89 | 31 | 351 | 1060 | 1080 | 447 | 308 | 331 | 713 | 337 | 187 | 420.5 |
| 1937 | 174 | 137 | 117 | 160 | 1500 | 855 | 433 | 396 | 563 | 532 | 467 | 235 | 464.08 |
| 1938 | 149 | 105 | 84 | 197 | 790 | 736 | 606 | 538 | 490 | 354 | 294 | 235 | 381.5 |
| 1939 | 149 | 106 | 88 | 90 | 826 | 889 | 685 | 427 | 447 | 453 | 320 | 258 | 394.83 |
| 1940 | 156 | 117 | 89 | 110 | 1240 | 1170 | 589 | 402 | 362 | 263 | 194 | 129 | 401.75 |
| 1941 | 92 | 75 | 70 | 289 | 691 | 467 | 308 | 244 | 569 | 572 | 308 | 249 | 327.83 |
| 1942 | 161 | 121 | 110 | 223 | 1650 | 917 | 357 | 222 | 340 | 608 | 487 | 216 | 451 |
| 1943 | 145 | 114 | 93 | 90 | 1050 | 1200 | 470 | 385 | 351 | 250 | 300 | 142 | 382.5 |
| 1944 | 99 | 74 | 63 | 68 | 832 | 671 | 365 | 541 | 600 | 447 | 297 | 186 | 353.58 |
| 1945 | 142 | 106 | 92 | 348 | 1030 | 798 | 521 | 337 | 388 | 464 | 289 | 190 | 392.08 |
| 1946 | 140 | 106 | 93 | 136 | 1160 | 920 | 490 | 311 | 2020 | 461 | 261 | 163 | 521.75 |
| 1947 | 121 | 112 | 100 | 82 | 866 | 1830 | 555 | 396 | 419 | 365 | 279 | 169 | 441.17 |
| 1948 | 119 | 79 | 68 | 85 | 1020 | 807 | 433 | 529 | 495 | 323 | 245 | 156 | 363.25 |
| 1949 | 128 | 102 | 83 | 150 | 951 | 1270 | 654 | 512 | 546 | 362 | 254 | 172 | 432 |
| 1950 | 128 | 104 | 91 | 171 | 982 | 1290 | 787 | 317 | 158 | 231 | 308 | 422 | 415.75 |
| 1951 | 207 | 150 | 119 | 461 | 1240 | 719 | 272 | 253 | 241 | 331 | 314 | 250 | 379.75 |
| 1952 | 145 | 119 | 95 | 125 | 1150 | 903 | 450 | 408 | 325 | 560 | 232 | 154 | 388.83 |
| 1953 | 120 | 112 | 104 | 430 | 1010 | 756 | 467 | 200 | 453 | 334 | 253 | 246 | 373.75 |
| 1954 | 153 | 120 | 113 | 143 | 1150 | 838 | 410 | 453 | 371 | 447 | 303 | 222 | 393.58 |
| 1955 | 156 | 111 | 96 | 186 | 1360 | 931 | 286 | 140 | 1390 | 184 | 195 | 135 | 430.83 |
| 1956 | 113 | 90 | 72 | 98 | 376 | 1160 | 637 | 453 | 475 | 447 | 251 | 166 | 361.5 |
| 1957 | 100 | 82 | 76 | 98 | 764 | 934 | 869 | 422 | 512 | 430 | 303 | 254 | 403.67 |
| 1958 | 209 | 153 | 148 | 416 | 1250 | 1430 | 696 | 439 | 490 | 371 | 217 | 158 | 498.08 |
| 1959 | 119 | 93 | 76 | 114 | 1110 | 968 | 591 | 368 | 248 | 385 | 362 | 229 | 388.58 |
| 1960 | 136 | 110 | 97 | 115 | 1410 | 770 | 410 | 679 | 433 | 388 | 325 | 218 | 424.25 |
| 1961 | 152 | 105 | 87 | 135 | 809 | 591 | 408 | 334 | 314 | 368 | 229 | 160 | 307.67 |
| 1962 | 132 | 100 | 86 | 168 | 903 | 846 | 334 | 374 | 484 | 306 | 229 | 160 | 343.5 |
| 1963 | 107 | 85 | 72 | 102 | 925 | 826 | 620 | 535 | 241 | 214 | 206 | 192 | 343.75 |
| 1964 | 121 | 106 | 85 | 140 | 1320 | 1030 | 501 | 569 | 368 | 385 | 233 | 255 | 426.08 |
| 1965 | 199 | 119 | 101 | 96 | 950 | 840 | 558 | 480 | 495 | 535 | 277 | 171 | 401.75 |
| 1966 | 130 | 112 | 102 | 192 | 893 | 1040 | 577 | 588 | 389 | 557 | 700 | 372 | 471 |
| 1967 | 196 | 135 | 106 | 91 | 529 | 953 | 471 | 477 | 305 | 507 | 276 | 160 | 350.5 |
| 1968 | 160 | 142 | 99.5 | 105 | 74.5 | 30 | 24 | 25 | 22.5 | 22 | 20 | 18 | 61.88 |
| 1969 | 18 | 17 | 15 | 22 | 120 | 38 | 20 | 25.5 | 78 | 155 | 224 | 408 | 95.04 |
| 1970 | 425 | 433 | 382 | 309 | 320 | 230 | 272 | 320 | 323 | 354 | 394 | 425 | 348.92 |
| 1971 | 436 | 439 | 388 | 408 | 362 | 279 | 286 | 320 | 303 | 294 | 275 | 371 | 346.75 |
| 1972 | 433 | 490 | 439 | 445 | 348 | 309 | 300 | 283 | 317 | 362 | 405 | 462 | 382.75 |
| 1973 | 416 | 456 | 268 | 314 | 493 | 462 | 518 | 504 | 348 | 357 | 459 | 436 | 419.25 |
| 1974 | 430 | 396 | 329 | 259 | 473 | 878 | 391 | 490 | 419 | 530 | 476 | 462 | 461.08 |
| 1975 | 445 | 487 | 507 | 456 | 289 | 205 | 294 | 241 | 204 | 303 | 428 | 518 | 364.75 |
| 1976 | 498 | 488 | 488 | 450 | 428 | 317 | 253 | 283 | 334 | 427 | 463 | 498 | 410.58 |
| 1977 | 490 | 512 | 416 | 323 | 370 | 311 | 302 | 276 | 306 | 512 | 402 | 421 | 386.75 |
| 1978 | 462 | 468 | 390 | 324 | 456 | 800 | 583 | 309 | 317 | 360 | 468 | 437 | 447.83 |
| 1979 | 454 | 457 | 413 | 518 | 549 | 491 | 444 | 677 | 386 | 498 | 459 | 524 | 489.17 |
| |
|
|
|
|
|
|
|
|
|
|
|
|
|
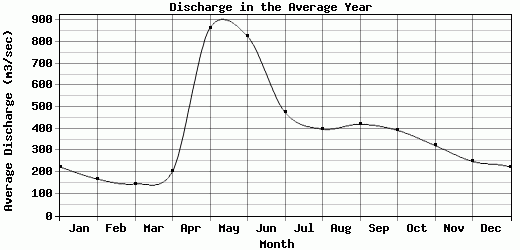
| Avg | 223.84 | 168.42 | 145.97 | 203.77 | 864.68 | 825.63 | 475.65 | 398.66 | 420.78 | 392.66 | 322.97 | 249.81 | 391.37 |
| |
|
|
|
|
|
|
|
|
|
|
|
|
|
| Std Dev | 180.95 |
138.54 |
123.18 |
125.24 |
347.13 |
353.44 |
168.71 |
155.9 |
277.78 |
130.98 |
120.83 |
116.76 |
78.61 |
| |
|
|
|
|
|
|
|
|
|
|
|
|
|
| | Jan | Feb | Mar | Apr | May | Jun | Jul | Aug | Sep | Oct | Nov | Dec | Avg Annual |
Click here for this table in tab-delimited format.
Tab-delimited format will open in most table browsing software, i.e. Excel, etc.
View this station on the map.
Return to start.