Results
| Country: | U.S.A.
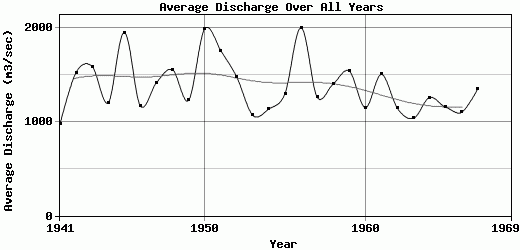
| | Station: | GLENROCK, WY | | River: | NORTH PLATTE RIVER | | Area: | 35061.34 | | Lat: | 42.84 | | Lon: | -105.75 | | Source: | USGS | | PointID: | 6646800 | | Area Units: | km2 | | Discharge Units: | m3/sec | | Starting Year: | 1941 | | Ending Year: | 1969 | | Total Years: | 29 | | Total Usable Years: | 27 | |
| |
| Year | Jan | Feb | Mar | Apr | May | Jun | Jul | Aug | Sep | Oct | Nov | Dec | Avg Annual |
|---|
| 1941 | 2064.58 | 1016.88 | 1786.8 | 1441.62 | 438 | 1591.51 | 634.57 | 603.43 | 367.18 | 286.28 | 608.82 | 798.54 | 969.85 |
| 1942 | 939.76 | 1964.49 | 3571.69 | 2416.86 | 1406.26 | 745.68 | 617.4 | 761.64 | 571.25 | 1041.76 | 1989.93 | 2222.88 | 1520.8 |
| 1943 | 3993.25 | 2577.76 | 3088.2 | 2353.52 | 2788.4 | 1392.82 | 823.11 | 651.99 | 210.95 | 236.31 | 545.39 | 357.52 | 1584.94 |
| 1944 | 783.4 | 1257.18 | 3739.49 | 2940.72 | 1792.56 | 844.6 | 277.83 | 179.04 | 198.22 | 517.28 | 433.72 | 1430.28 | 1199.53 |
| 1945 | 1628.41 | 2716.71 | 6193.93 | 2389.29 | 2172.64 | 1118.99 | 449.99 | 420.95 | 1212.68 | 1391.19 | 2051.94 | 1591.51 | 1944.85 |
| 1946 | 1861.8 | 1585.04 | 2576.85 | 734.17 | 1985.66 | 2780.82 | 526.6 | 307.34 | 142.95 | 299.1 | 336.33 | 835.72 | 1164.37 |
| 1947 | 2699.16 | 1454.08 | 1754.28 | 2667.74 | 2745.93 | 2310.1 | 775.98 | 560.22 | 423.71 | 184.69 | 530.94 | 834.8 | 1411.8 |
| 1948 | 1180.91 | 2443.56 | 3020.97 | 3977.41 | 2036.81 | 1012.33 | 932.36 | 599.24 | 295.13 | 362.37 | 694.75 | 2050.97 | 1550.57 |
| 1949 | 3134.87 | 2946.99 | 1965.02 | 1928.77 | 995.75 | 427.37 | 573.46 | 401.91 | 276.37 | 225.69 | 406.92 | 1421.06 | 1225.35 |
| 1950 | 3835.58 | 3833.72 | 2916.1 | 2619.13 | 1599.91 | 1395.65 | 898.65 | 354.73 | 708.96 | 492.17 | 1753.58 | 3398.95 | 1983.93 |
| 1951 | 3566.85 | 3812.38 | 3356.02 | 3221.34 | 1506.56 | 1376.02 | 877.55 | 230.49 | 208.46 | 178.29 | 788.16 | 1935.7 | 1754.82 |
| 1952 | 4608.91 | 2940.48 | 2825.03 | 2461.6 | 2188.08 | 561.38 | 287.07 | 277.8 | 199.13 | 155.74 | 332.09 | 819.45 | 1471.4 |
| 1953 | 1835.58 | 1730.17 | 2146.15 | 2162.38 | 2163.6 | 1148.44 | 347.65 | 299.43 | 216.75 | 144 | 167.49 | 423.73 | 1065.45 |
| 1954 | 868.26 | 1006.26 | 2142.59 | 2207.59 | 1267.69 | 687.4 | 282.84 | 570.91 | 273.14 | 1925.43 | 739.64 | 1623.02 | 1132.9 |
| 1955 | 1974.61 | 2650.67 | 4354.15 | 1698.55 | 783.28 | 642.44 | 329.96 | 484.28 | 189.19 | 493.6 | 1147.03 | 797.81 | 1295.46 |
| 1956 | 490.47 | 3902.86 | 4155.75 | 3085.42 | 3100.44 | 1985.87 | 1517.52 | 1874.59 | 931.16 | 391.02 | 473.84 | 2030.6 | 1994.96 |
| 1957 | 1928.57 | 2330.08 | 1691.99 | 3657.61 | 1122.54 | 620.05 | 623.82 | 191.59 | 227.06 | 241.58 | 414.55 | 2073.17 | 1260.22 |
| 1958 | 1347.98 | 1009.4 | 1881.71 | 2215.33 | 2781.55 | 903.78 | 1926.65 | 1712.17 | 838.09 | 495.18 | 771.07 | 888.7 | 1397.63 |
| 1959 | 2920.3 | 3448 | 2281.71 | 2105.09 | 1663.3 | 683.1 | 475.19 | 367.74 | 218.02 | 652.72 | 1242.08 | 2370.5 | 1535.65 |
| 1960 | 2559.77 | 2131.68 | 1276.91 | 2997.64 | 1798.13 | 1002.8 | 402.65 | 367.16 | 363.05 | 212.29 | 368.56 | 288.99 | 1147.47 |
| 1961 | 669.38 | 2170.5 | 4016.99 | 3610.32 | 2186.16 | 1512.51 | 669.56 | 672.58 | 258.82 | 255.91 | 841.71 | 1143.92 | 1500.7 |
| 1962 | 1784.43 | 1769.1 | 3349.26 | 2875.87 | 703.81 | 487.94 | 233.09 | 174.55 | 212.18 | 368.82 | 1016.39 | 686.09 | 1138.46 |
| 1963 | 1056.59 | 849 | 5289.34 | 1822.29 | 699.61 | 931.36 | 267.65 | 274.24 | 197.6 | 138.2 | 317.93 | 563.35 | 1033.93 |
| 1964 | 1298.82 | 761.43 | 4770.04 | 3364.06 | 1238.76 | 666.58 | 371.86 | 372.26 | 176.97 | 202.04 | 322.95 | 1517.24 | 1255.25 |
| 1965 | 2443.57 | 2292.56 | 2614.21 | 2607.24 | 859.56 | 347.53 | 208.58 | 178 | 307.2 | 418.56 | 764.21 | 776.43 | 1151.47 |
| 1966 | 1295.55 | 2813.5 | 1758.12 | 1765.94 | 2168.99 | 355.57 | 221.15 | 212.78 | 214.24 | 260.95 | 593.67 | 1524.82 | 1098.77 |
| 1967 | 571.69 | 1244.13 | 4017.91 | 2057.51 | 2935.65 | 495.9 | 479.06 | 463.47 | 384.17 | 901.27 | 1159.11 | 1467.28 | 1348.1 |
| 1968 | -9999 | -9999 | -9999 | -9999 | -9999 | -9999 | -9999 | -9999 | -9999 | -9999 | -9999 | -9999 | -9999 |
| 1969 | -9999 | -9999 | -9999 | -9999 | -9999 | -9999 | -9999 | -9999 | -9999 | -9999 | -9999 | -9999 | -9999 |
| |
|
|
|
|
|
|
|
|
|
|
|
|
|
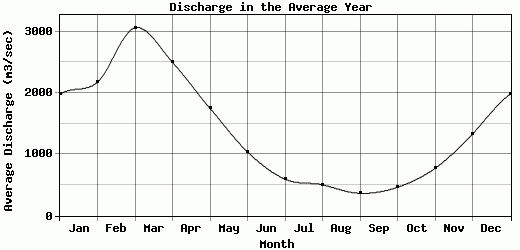
| Avg | 1975.67 | 2172.54 | 3057.08 | 2495.74 | 1745.54 | 1038.09 | 593.77 | 502.39 | 363.8 | 461.94 | 770.84 | 1328.63 | 1375.5 |
| |
|
|
|
|
|
|
|
|
|
|
|
|
|
| Std Dev | 1104.04 |
927.51 |
1198.32 |
717.02 |
738.45 |
592.66 |
389.48 |
400.92 |
259.57 |
407.56 |
495.17 |
721.61 |
283.76 |
| |
|
|
|
|
|
|
|
|
|
|
|
|
|
| | Jan | Feb | Mar | Apr | May | Jun | Jul | Aug | Sep | Oct | Nov | Dec | Avg Annual |
Click here for this table in tab-delimited format.
Tab-delimited format will open in most table browsing software, i.e. Excel, etc.
View this station on the map.
Return to start.