Results
| Country: | U.S.A.
| | Station: | LINGLE, WYO. | | River: | NORTH PLATTE RIVER | | Area: | 54739.00 | | Lat: | 42.1 | | Lon: | -104.35 | | Source: | USGS | | PointID: | 6670900 | | Area Units: | km2 | | Discharge Units: | m3/sec | | Starting Year: | 1938 | | Ending Year: | 1972 | | Total Years: | 35 | | Total Usable Years: | 17 | |
| |
| Year | Jan | Feb | Mar | Apr | May | Jun | Jul | Aug | Sep | Oct | Nov | Dec | Avg Annual |
|---|
| 1938 | -9999 | -9999 | -9999 | -9999 | -9999 | -9999 | -9999 | -9999 | -9999 | -9999 | -9999 | -9999 | -9999 |
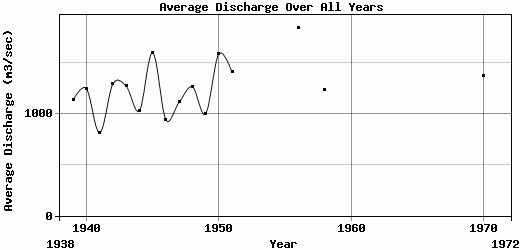
| 1939 | 1364.17 | 3576.94 | 3052.7 | 2886.45 | 605.98 | 474.31 | 311.49 | 126.58 | 85.8 | 371.24 | 172.17 | 625.6 | 1137.79 |
| 1940 | 481.06 | 1375.7 | 2061.02 | 4736.02 | 1026.99 | 1432.93 | 621.28 | 246.8 | 306.42 | 201.65 | 757.2 | 1711.35 | 1246.54 |
| 1941 | 1690.34 | 797.63 | 1517.7 | 1326.09 | 375.39 | 1306.55 | 486.46 | 486.5 | 306.2 | 230.28 | 508.01 | 697.15 | 810.69 |
| 1942 | 823.39 | 1549.34 | 3092.03 | 1941.32 | 1188.22 | 570.02 | 517.91 | 669.47 | 489.13 | 944.22 | 1794.26 | 1932.77 | 1292.67 |
| 1943 | 3250.43 | 2163.82 | 2294.32 | 1948.3 | 2334.6 | 1022.68 | 583.18 | 472.25 | 171.6 | 205.15 | 487.62 | 322.63 | 1271.38 |
| 1944 | 709.72 | 1136.98 | 3101.99 | 2402.23 | 1542.36 | 721.61 | 242.17 | 143.09 | 173.54 | 490.87 | 384.62 | 1305.78 | 1029.58 |
| 1945 | 1404.71 | 2336.96 | 4911.81 | 1799.07 | 1670.16 | 821.1 | 350.45 | 391.4 | 1112.35 | 1265.04 | 1774.15 | 1341.13 | 1598.19 |
| 1946 | 1618.45 | 1204.38 | 2065.31 | 625.71 | 1657.91 | 2130.57 | 417.82 | 245.89 | 118.98 | 256.27 | 276.09 | 681.95 | 941.61 |
| 1947 | 2165.98 | 1131.06 | 1569.49 | 2212.6 | 2077.19 | 1665.7 | 507.16 | 427.68 | 309.39 | 133.98 | 423.05 | 713.67 | 1111.41 |
| 1948 | 937.84 | 1940.89 | 2446.13 | 3096.56 | 1681.39 | 871.69 | 794.25 | 528.62 | 239.82 | 313.5 | 612.17 | 1708.15 | 1264.25 |
| 1949 | 2532.27 | 2237.65 | 1596.8 | 1627.57 | 849.42 | 325.15 | 420.97 | 329.75 | 227.62 | 185.8 | 367.48 | 1288.79 | 999.11 |
| 1950 | 2741.82 | 2875.39 | 2404.57 | 2125.57 | 1269.61 | 1094.07 | 705.55 | 309.03 | 647.8 | 472.04 | 1640.69 | 2782.83 | 1589.08 |
| 1951 | 2843.21 | 3019.91 | 2513 | 2585.06 | 1211.05 | 1267.85 | 717.84 | 192.14 | 178.35 | 138.7 | 682.44 | 1524.19 | 1406.14 |
| 1952 | -9999 | -9999 | -9999 | -9999 | -9999 | -9999 | -9999 | -9999 | -9999 | -9999 | -9999 | -9999 | -9999 |
| 1953 | -9999 | -9999 | -9999 | -9999 | -9999 | -9999 | -9999 | -9999 | -9999 | -9999 | -9999 | -9999 | -9999 |
| 1954 | -9999 | -9999 | -9999 | -9999 | -9999 | -9999 | -9999 | -9999 | -9999 | -9999 | -9999 | -9999 | -9999 |
| 1955 | -9999 | -9999 | -9999 | -9999 | -9999 | -9999 | -9999 | -9999 | -9999 | -9999 | -9999 | -9999 | -9999 |
| 1956 | 1662.21 | 3363.96 | 3454.95 | 2686.15 | 2545.97 | 1509.39 | 1232.06 | 1744.6 | 840.35 | 558.25 | 618.57 | 1903.82 | 1843.36 |
| 1957 | -9999 | -9999 | -9999 | -9999 | -9999 | -9999 | -9999 | -9999 | -9999 | -9999 | -9999 | -9999 | -9999 |
| 1958 | 1050.01 | 880.89 | 1662.3 | 1962.46 | 2459.49 | 784.26 | 1840.61 | 1327.24 | 742.81 | 539.31 | 768.81 | 790.96 | 1234.1 |
| 1959 | -9999 | -9999 | -9999 | -9999 | -9999 | -9999 | -9999 | -9999 | -9999 | -9999 | -9999 | -9999 | -9999 |
| 1960 | -9999 | -9999 | -9999 | -9999 | -9999 | -9999 | -9999 | -9999 | -9999 | -9999 | -9999 | -9999 | -9999 |
| 1961 | -9999 | -9999 | -9999 | -9999 | -9999 | -9999 | -9999 | -9999 | -9999 | -9999 | -9999 | -9999 | -9999 |
| 1962 | -9999 | -9999 | -9999 | -9999 | -9999 | -9999 | -9999 | -9999 | -9999 | -9999 | -9999 | -9999 | -9999 |
| 1963 | -9999 | -9999 | -9999 | -9999 | -9999 | -9999 | -9999 | -9999 | -9999 | -9999 | -9999 | -9999 | -9999 |
| 1964 | -9999 | -9999 | -9999 | -9999 | -9999 | -9999 | -9999 | -9999 | -9999 | -9999 | -9999 | -9999 | -9999 |
| 1965 | -9999 | -9999 | -9999 | -9999 | -9999 | -9999 | -9999 | -9999 | -9999 | -9999 | -9999 | -9999 | -9999 |
| 1966 | -9999 | -9999 | -9999 | -9999 | -9999 | -9999 | -9999 | -9999 | -9999 | -9999 | -9999 | -9999 | -9999 |
| 1967 | -9999 | -9999 | -9999 | -9999 | -9999 | -9999 | -9999 | -9999 | -9999 | -9999 | -9999 | -9999 | -9999 |
| 1968 | -9999 | -9999 | -9999 | -9999 | -9999 | -9999 | -9999 | -9999 | -9999 | -9999 | -9999 | -9999 | -9999 |
| 1969 | -9999 | -9999 | -9999 | -9999 | -9999 | -9999 | -9999 | -9999 | -9999 | -9999 | -9999 | -9999 | -9999 |
| 1970 | 1269.61 | 2083.73 | 1671.98 | 2633.58 | 1030.65 | 713.31 | 703.03 | 765.97 | 598.62 | 1064.58 | 1752.82 | 2182.42 | 1372.53 |
| 1971 | -9999 | -9999 | -9999 | -9999 | -9999 | -9999 | -9999 | -9999 | -9999 | -9999 | -9999 | -9999 | -9999 |
| 1972 | -9999 | -9999 | -9999 | -9999 | -9999 | -9999 | -9999 | -9999 | -9999 | -9999 | -9999 | -9999 | -9999 |
| |
|
|
|
|
|
|
|
|
|
|
|
|
|
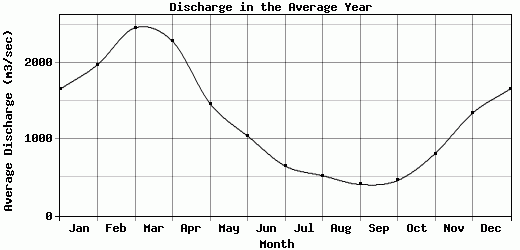
| Avg | 1659.08 | 1979.7 | 2463.51 | 2287.17 | 1470.4 | 1044.45 | 653.26 | 525.44 | 409.3 | 460.68 | 813.76 | 1344.57 | 1259.28 |
| |
|
|
|
|
|
|
|
|
|
|
|
|
|
| Std Dev | 802.76 |
857.99 |
873.06 |
870.39 |
626.7 |
466.58 |
381.97 |
425.51 |
289.15 |
335.89 |
558.3 |
654.64 |
257.45 |
| |
|
|
|
|
|
|
|
|
|
|
|
|
|
| | Jan | Feb | Mar | Apr | May | Jun | Jul | Aug | Sep | Oct | Nov | Dec | Avg Annual |
Click here for this table in tab-delimited format.
Tab-delimited format will open in most table browsing software, i.e. Excel, etc.
View this station on the map.
Return to start.